Business & Markets
Pricing, competition, advertising, and market structure — data stories and teaching cases from the business world.
33 pieces
 TeachingNew
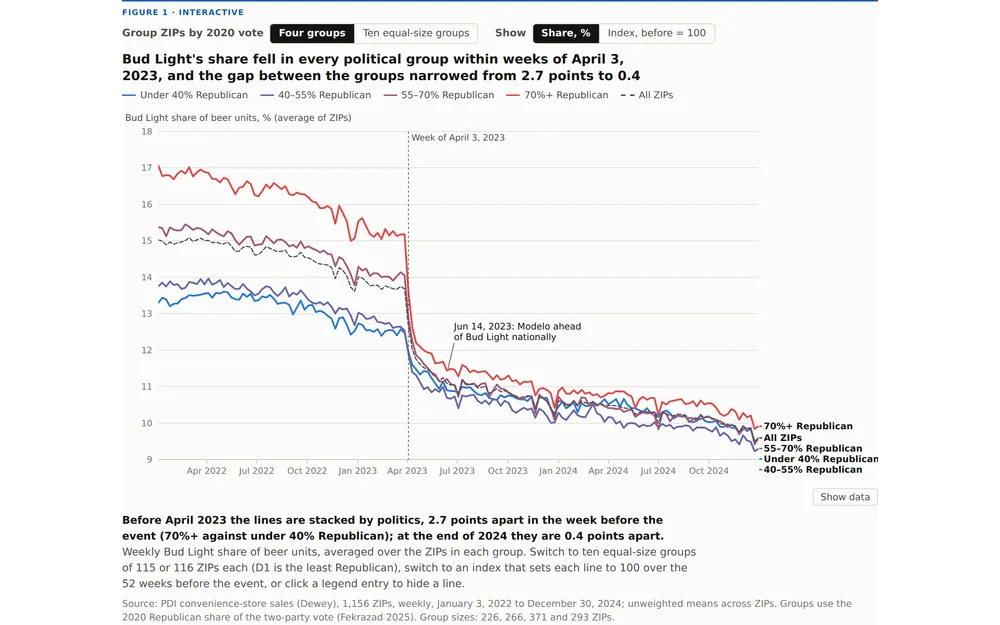
Bud Light and the price of a political brand
Bud Light’s share of beer units in the average ZIP fell from 13.7% to 10.5% within a year of April 2023, and the loss was 17% in ZIPs under 40% Republican against 29% in ZIPs at least 70% Republican.
 App
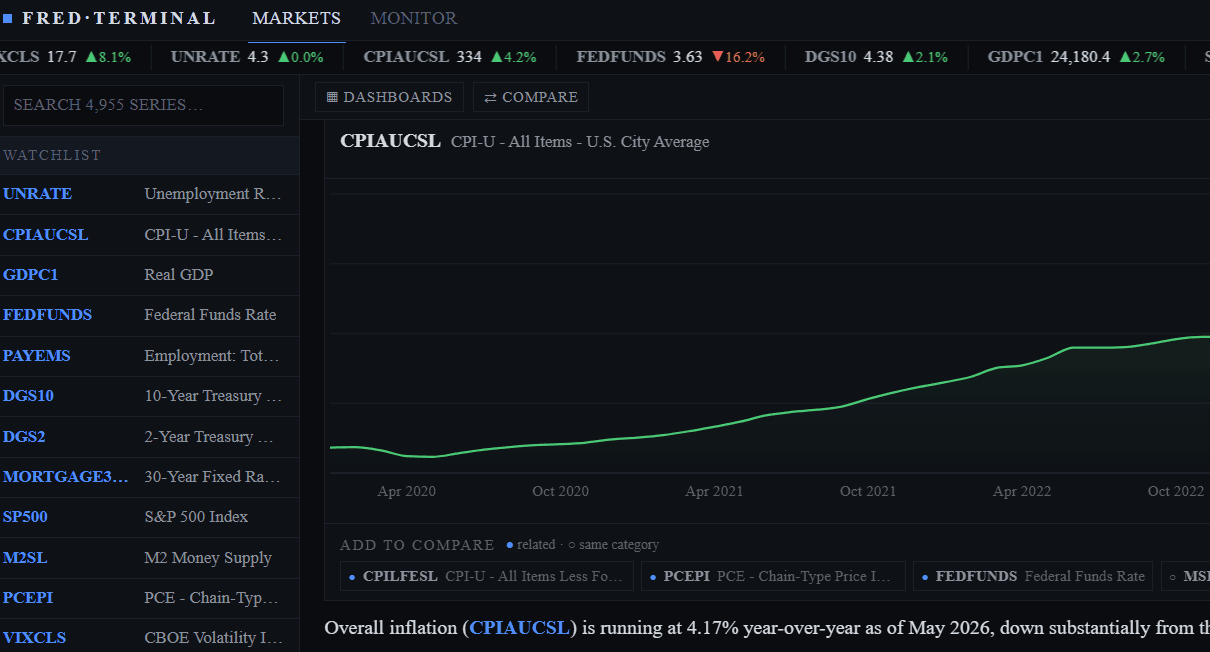
AppChat FRED
Chat with the Federal Reserve Economic Data API. Explore economic indicators, time series, and datasets through natural conversation—powered by cached data for instant responses.
 Teaching
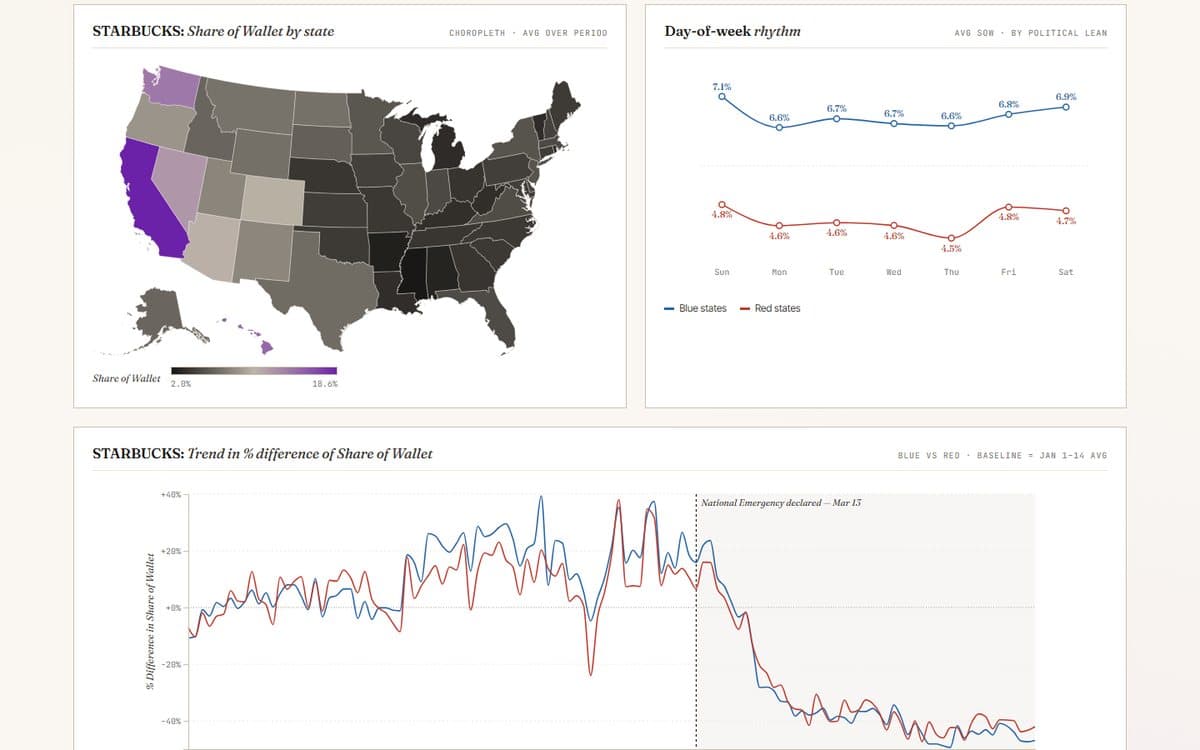
Fast-Food Share of Wallet: COVID Impact
How did the pandemic redraw where consumers spent their fast-food dollars? A share-of-wallet dashboard that benchmarks chains against the category through the shock and recovery.
 App
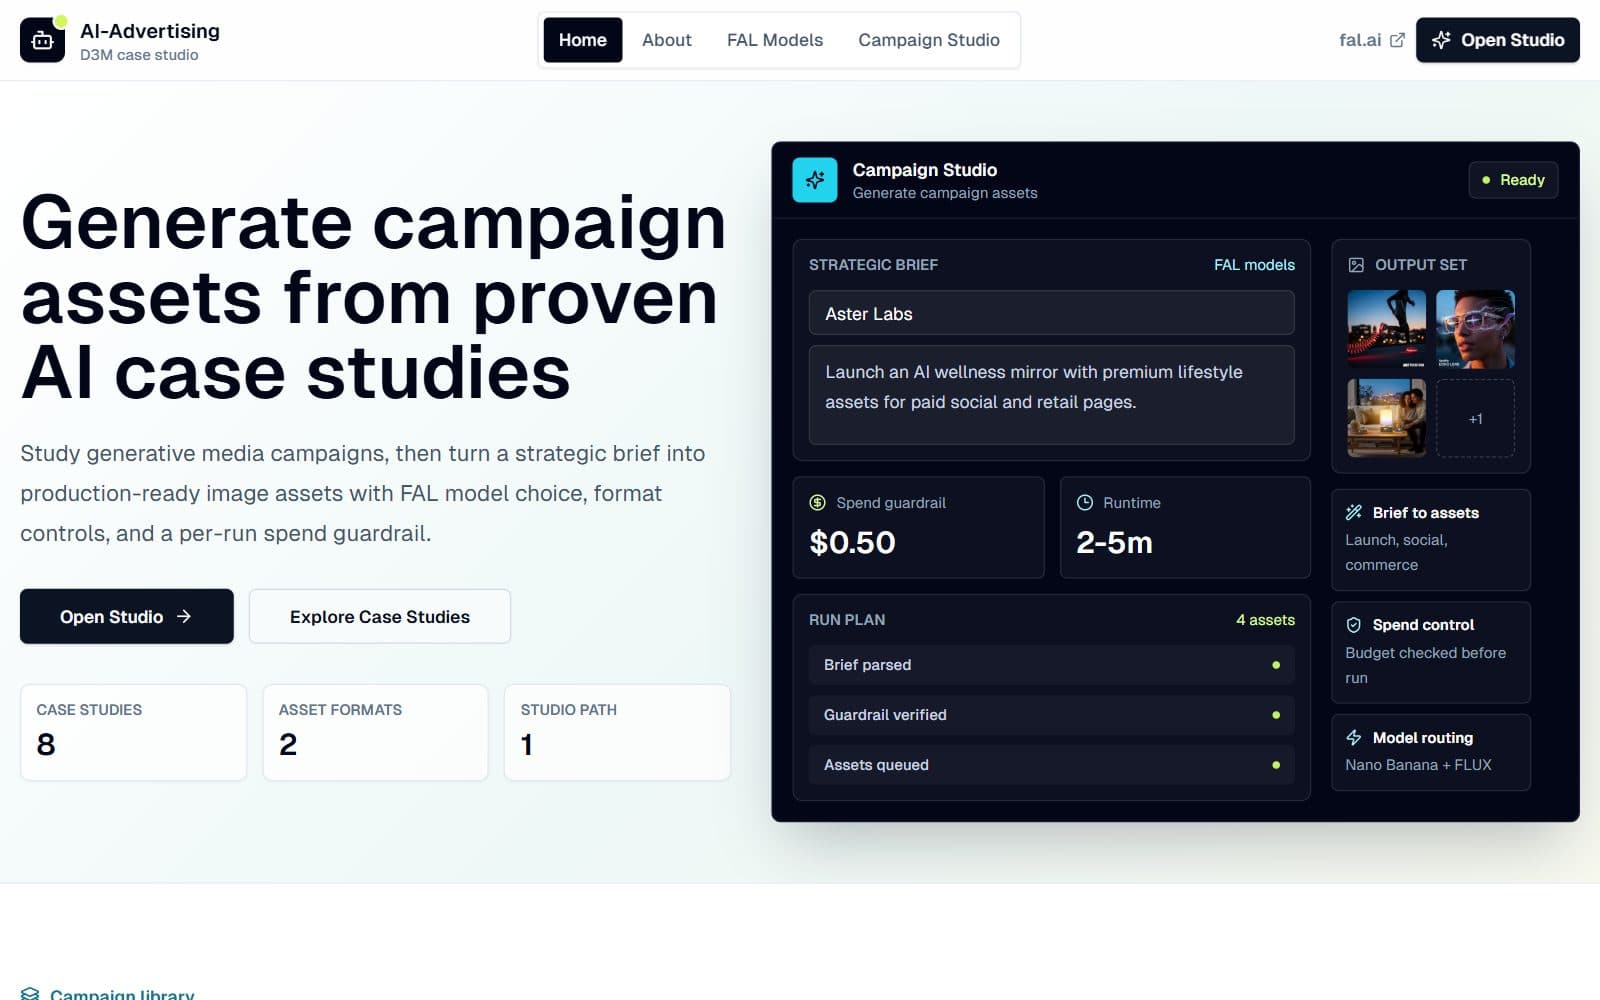
AppFAL Campaign Studio — AI Marketing Case Studies
Teaching case studies and FAL-powered tools for generative AI in creative marketing — study real campaigns, then turn a strategic brief into production-ready image assets.
 Teaching
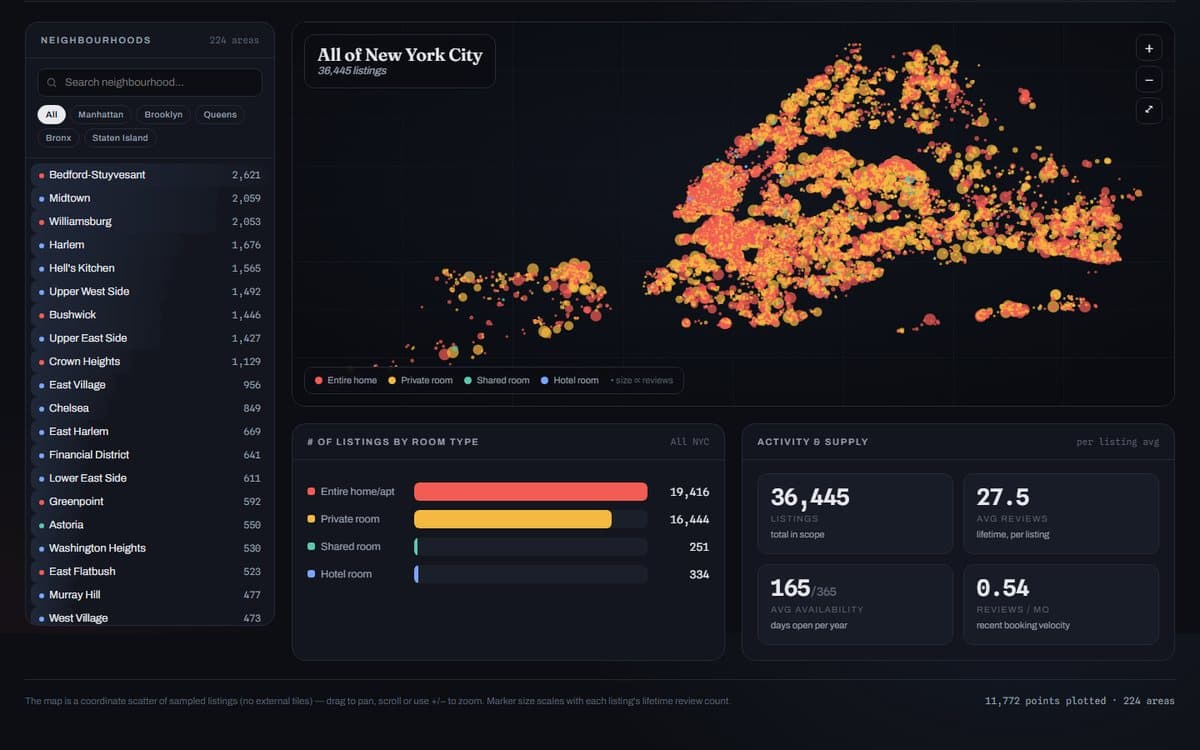
NYC Airbnb: A Listings Atlas
Explore tens of thousands of NYC listings by neighborhood, room type, and price — a worked example of how exploratory views turn a raw marketplace dump into a map of where supply and money actually sit.
 App
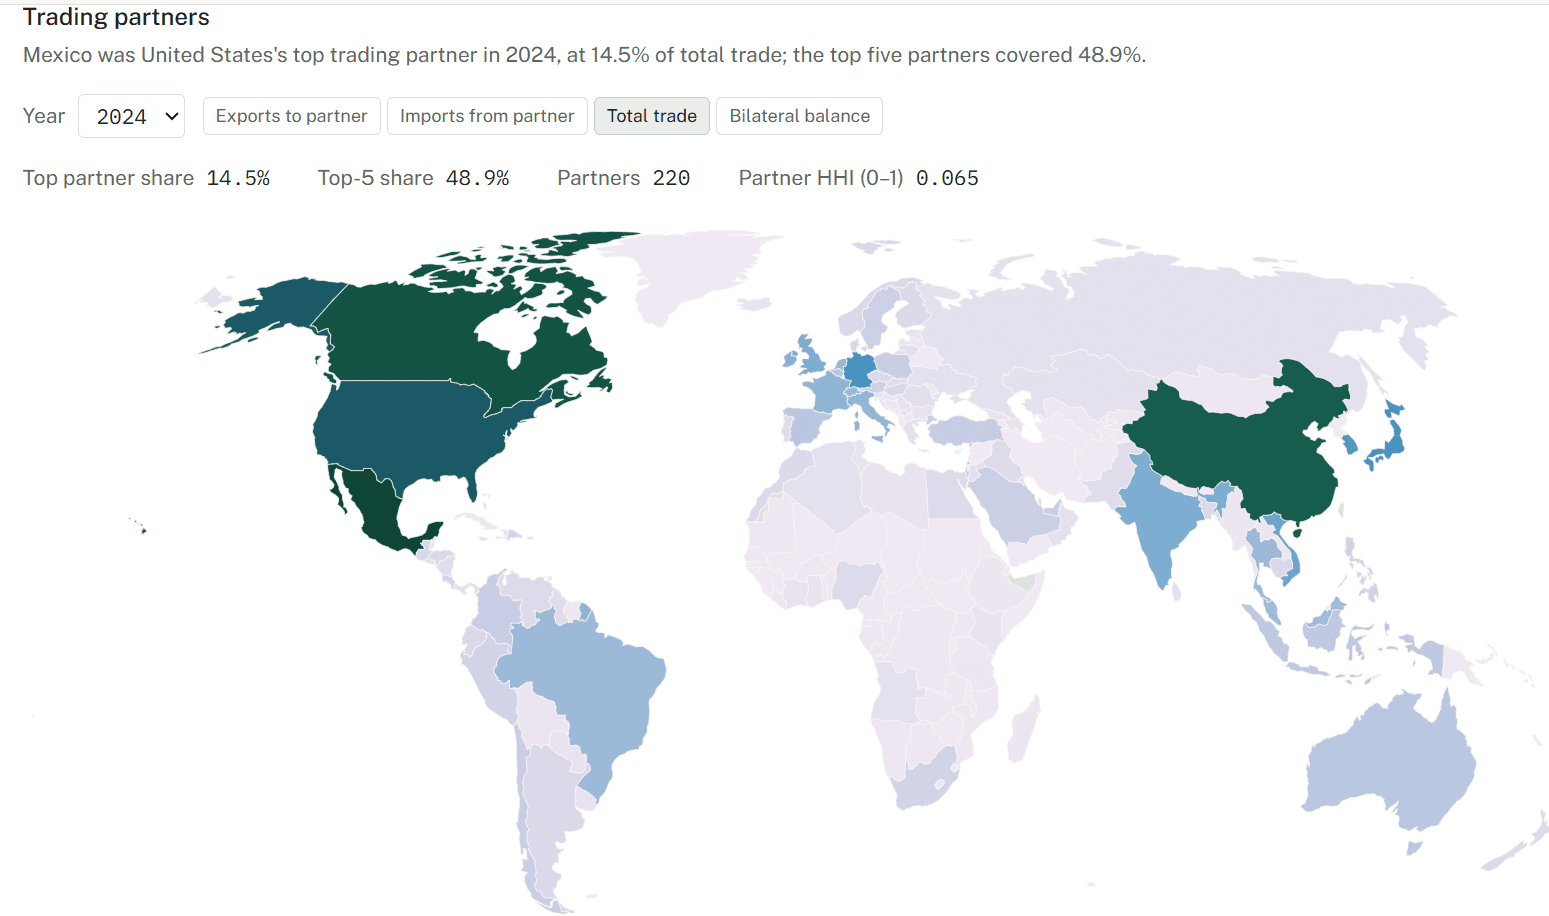
AppWorld Trade Atlas
A bilateral goods-trade explorer — 226 countries × 5,021 products, 1995–2024 (CEPII BACI), with country profiles, comparisons, and stories.
 TeachingNew
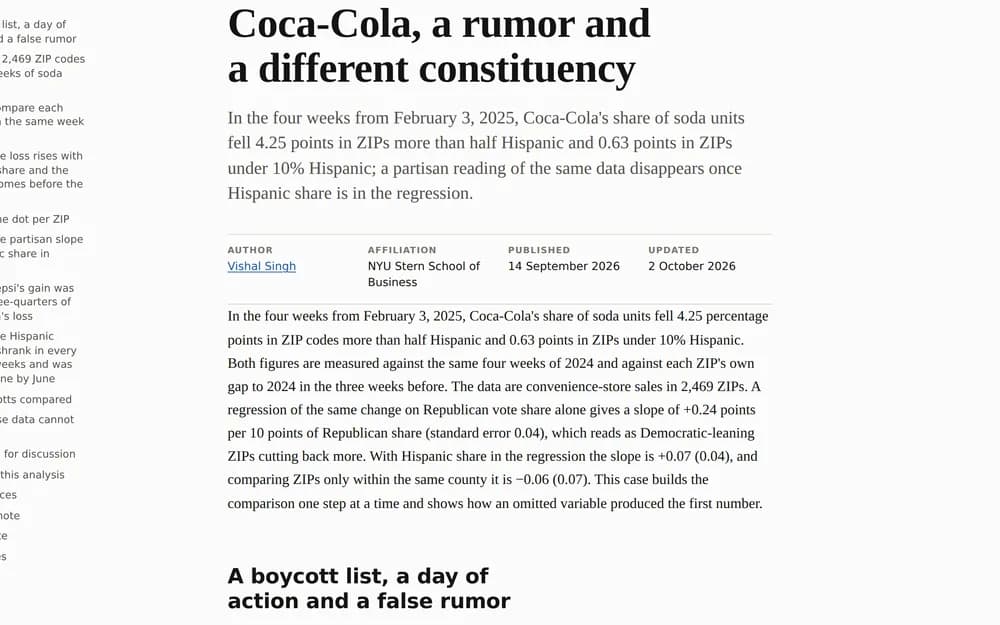
Coca-Cola, a rumor and a different constituency
In the four weeks from February 3, 2025, Coca-Cola’s share of soda units fell 4.25 points in ZIPs more than half Hispanic and 0.63 points in ZIPs under 10% Hispanic; a partisan reading of the same data disappears once Hispanic share is i…
 TeachingNew
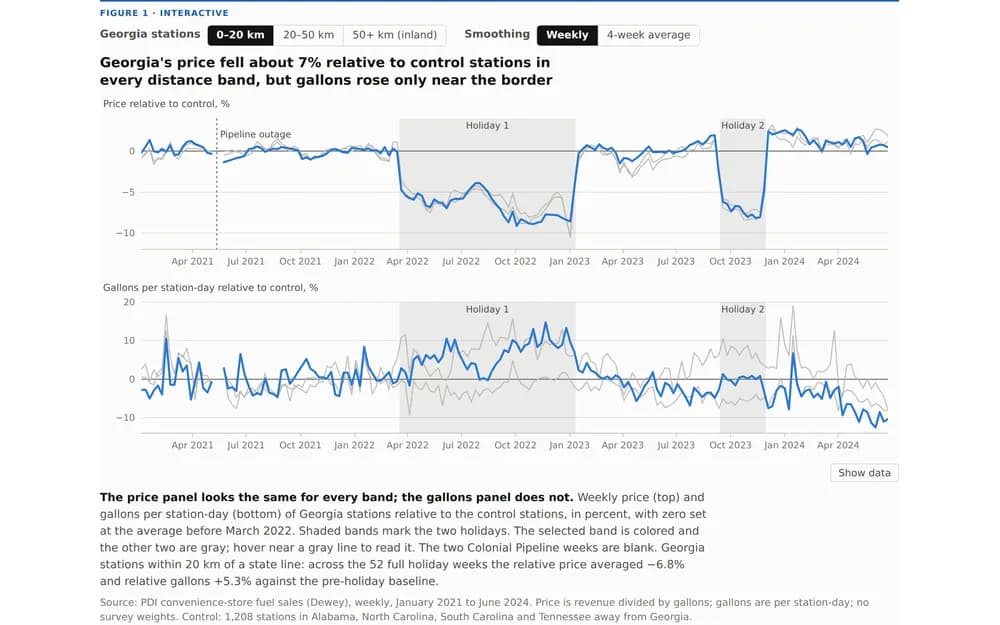
How far will drivers go for 29 cents?
Georgia stations within 20 km of a state line sold about 7% more gasoline in a full tax-holiday week (elasticity −0.97, s.e. 0.09); stations more than 50 km inland, with the same price cut, sold no more (+0.12, s.e. 0.08).
 TeachingNew
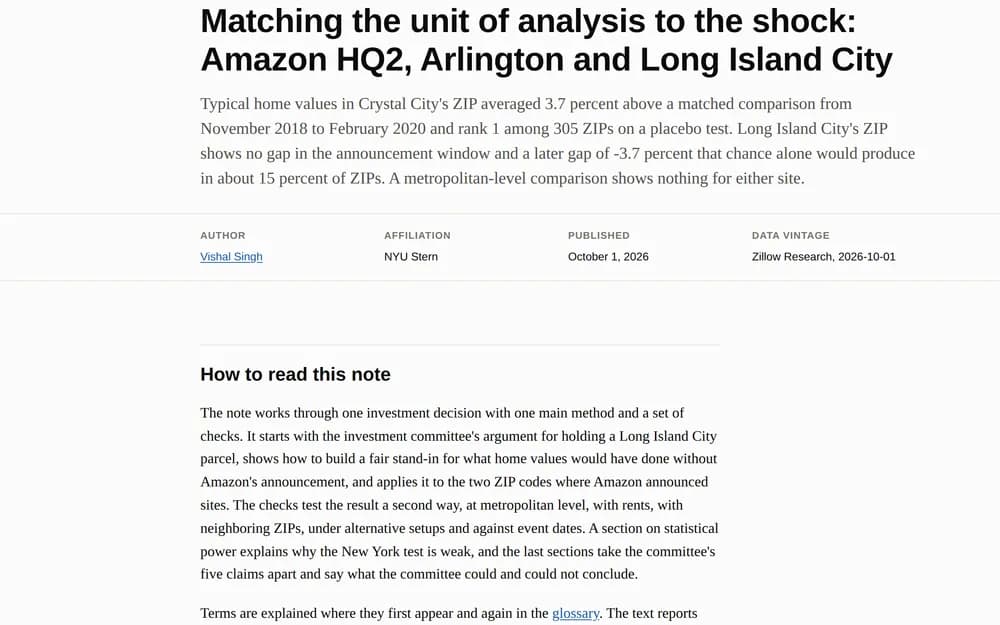
Matching the unit of analysis to the shock: Amazon HQ2, Arlington and Long Island City
Typical home values in Crystal City’s ZIP averaged 3.7 percent above a matched comparison from November 2018 to February 2020 and rank 1 among 305 ZIPs on a placebo test. Long Island City’s ZIP shows no gap in the announcement window and…
 Blog
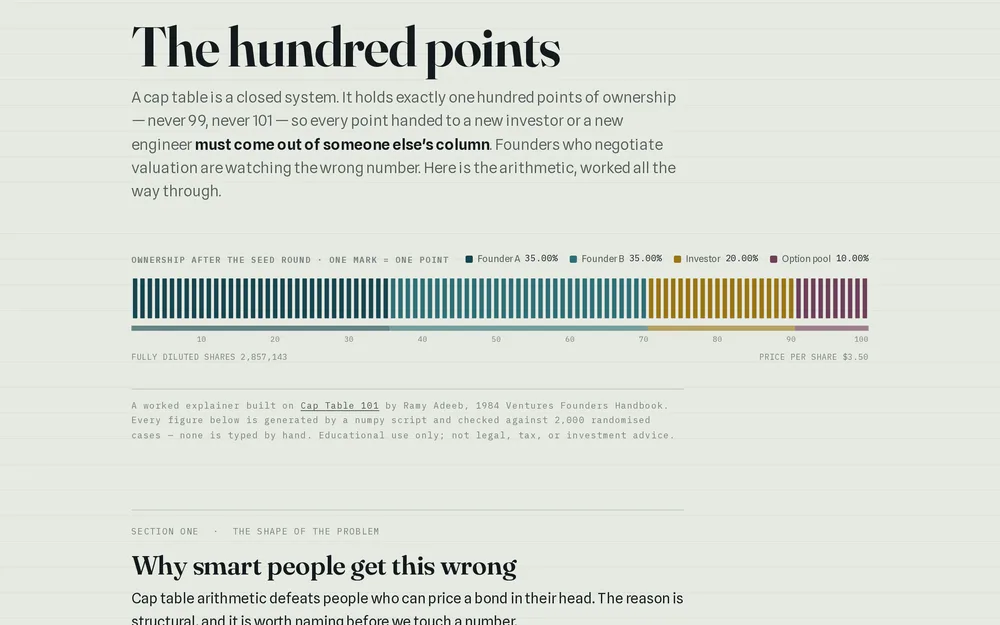
BlogThe Hundred Points — How a cap table actually works
A worked, interactive explainer on priced rounds, dilution, and the option pool shuffle — for MBA students who need to read a term sheet, not just admire the valuation.
 TeachingNew
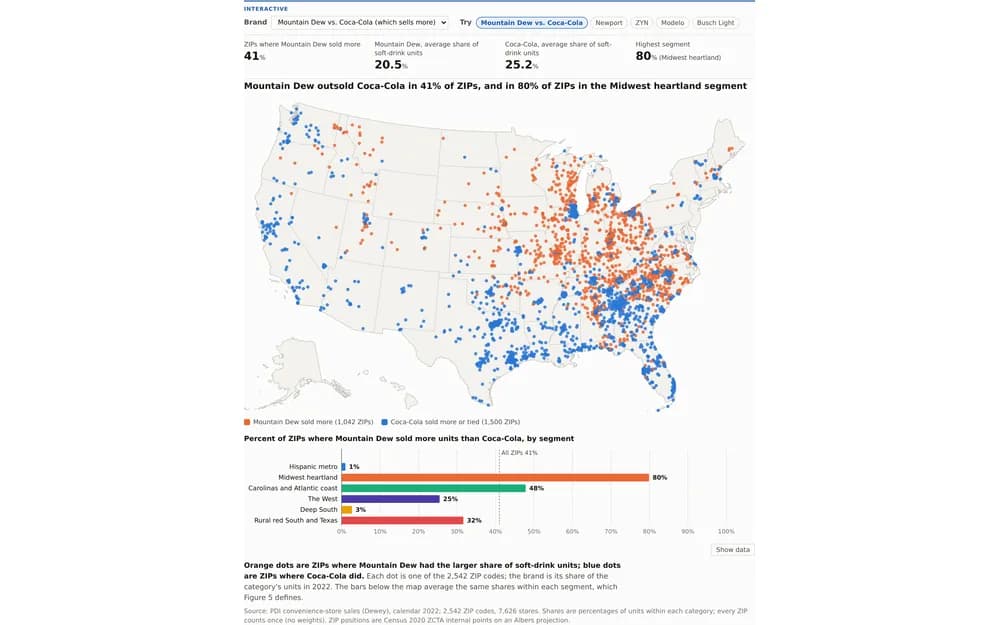
What the checkout counter says about a neighborhood
Forty convenience-store brand shares in 2,542 ZIP codes reduce to three components that line up with race, region and education, and the shares predict a ZIP’s 2020 Republican vote about as well as eight census variables do (out-of-sampl…
 TeachingNew
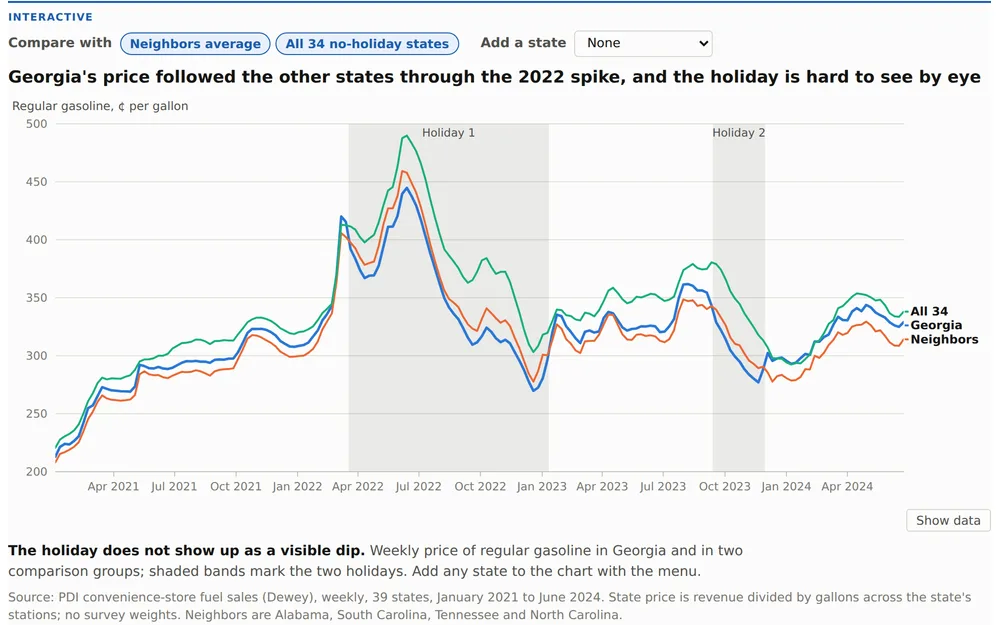
Who got Georgia’s 29 cents?
Against a synthetic Georgia built from 34 other states, pump prices fell 24.6¢ a gallon during the 2022 gas-tax holiday, 85% of the 29.1¢ tax cut. A simple before-and-after comparison says prices rose 59¢.
 Teaching
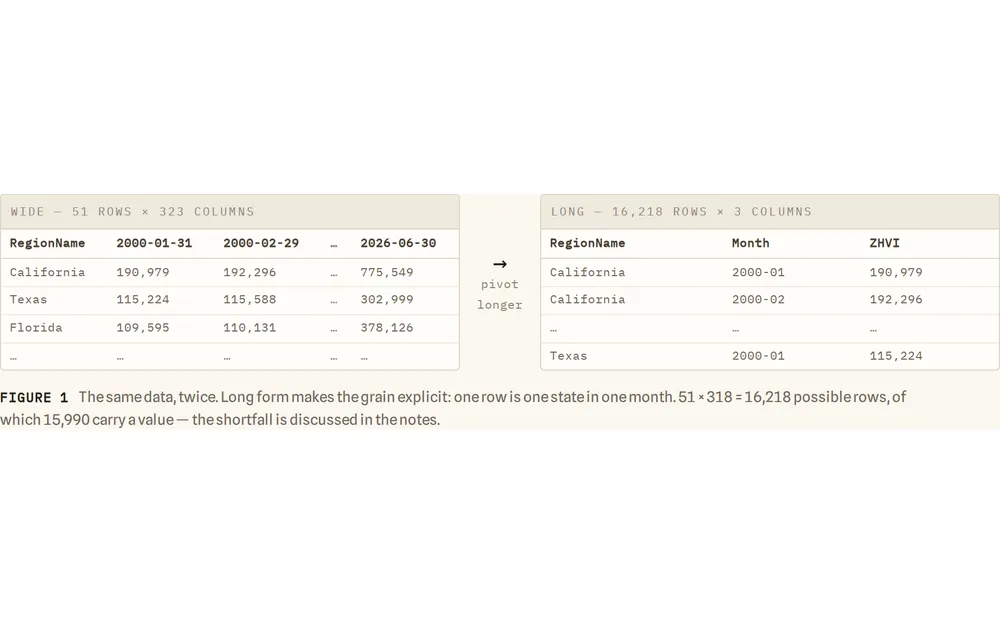
Fifty-One Time Series — Reading state home values, 2000–2026
An interactive walk through 26 years of state-level Zillow Home Value Index data: the 2008 bust, the pandemic boom, and why the base date decides who wins.
 Blog
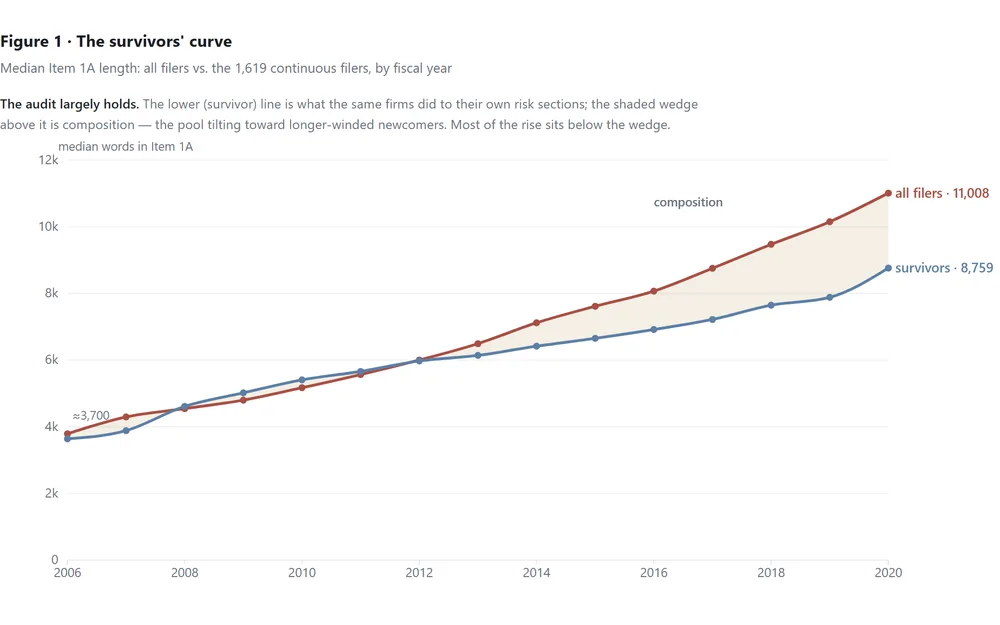
BlogThe Survivors' Curve
We reported that SEC risk sections tripled. Re-run on the 1,619 companies that filed every year, most of the growth survives the audit — but not the story about why.
 Blog
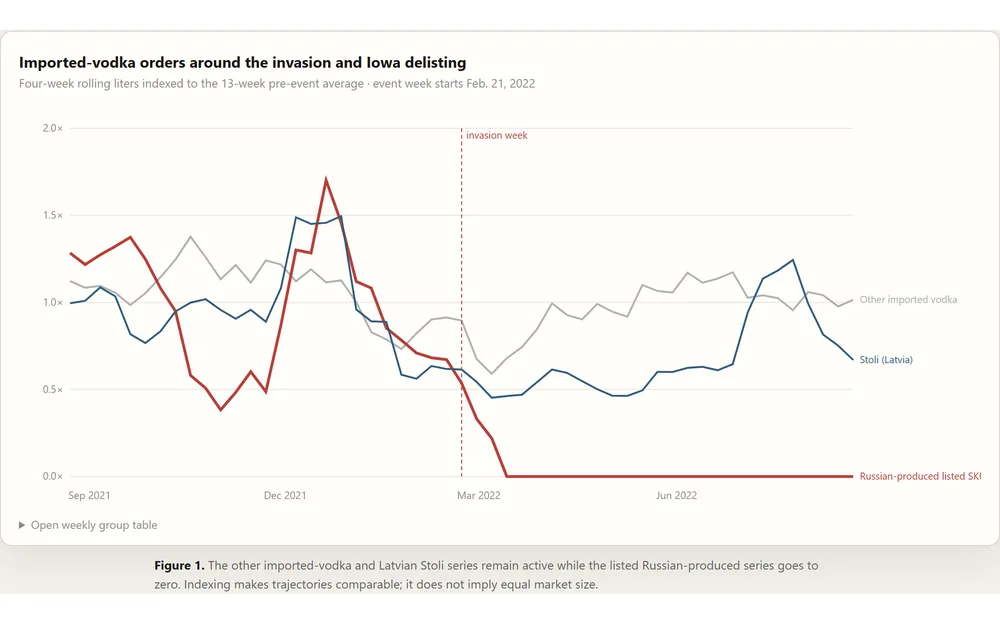
BlogThe Week Russian Vodka Vanished
A regression-backed Iowa Liquor teaching case on Russia's invasion, product delisting, and what a difference-in-differences estimate actually measures.
 Blog
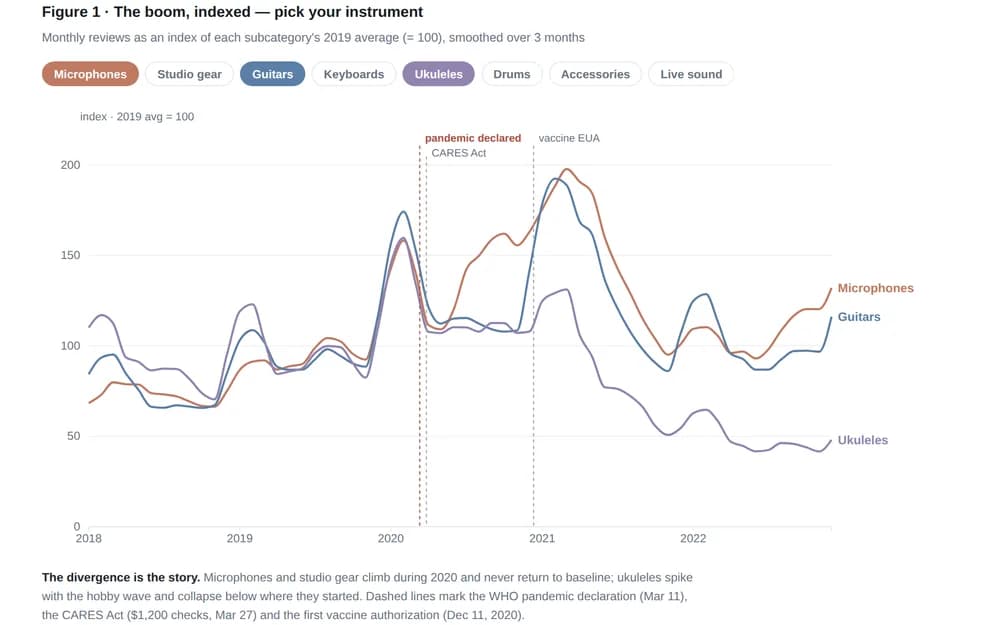
BlogThe Instrument Boom That Arrived Late
Three million Amazon reviews of musical instruments show a pandemic boom that was delayed by a shipping crunch — and a creator-economy shift that never reverted.
 Blog
BlogThe Risk Section That Ate the 10-K
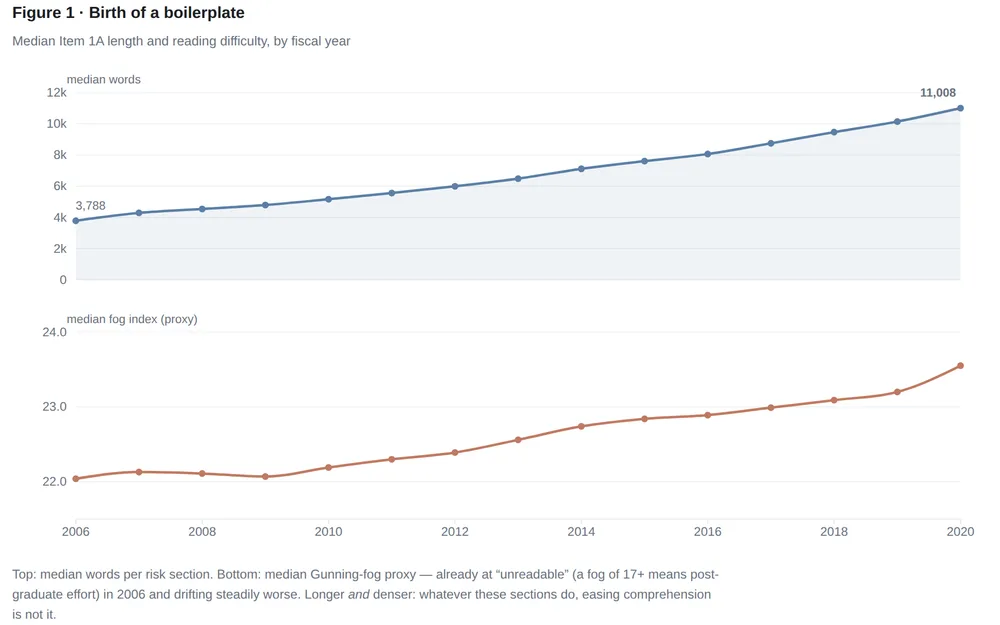
91,493 annual reports, fifteen years: corporate risk disclosure tripled in length, got harder to read, and learned new words on a schedule you can date.
 Teaching
Countercyclical Pricing: Progresso Soup
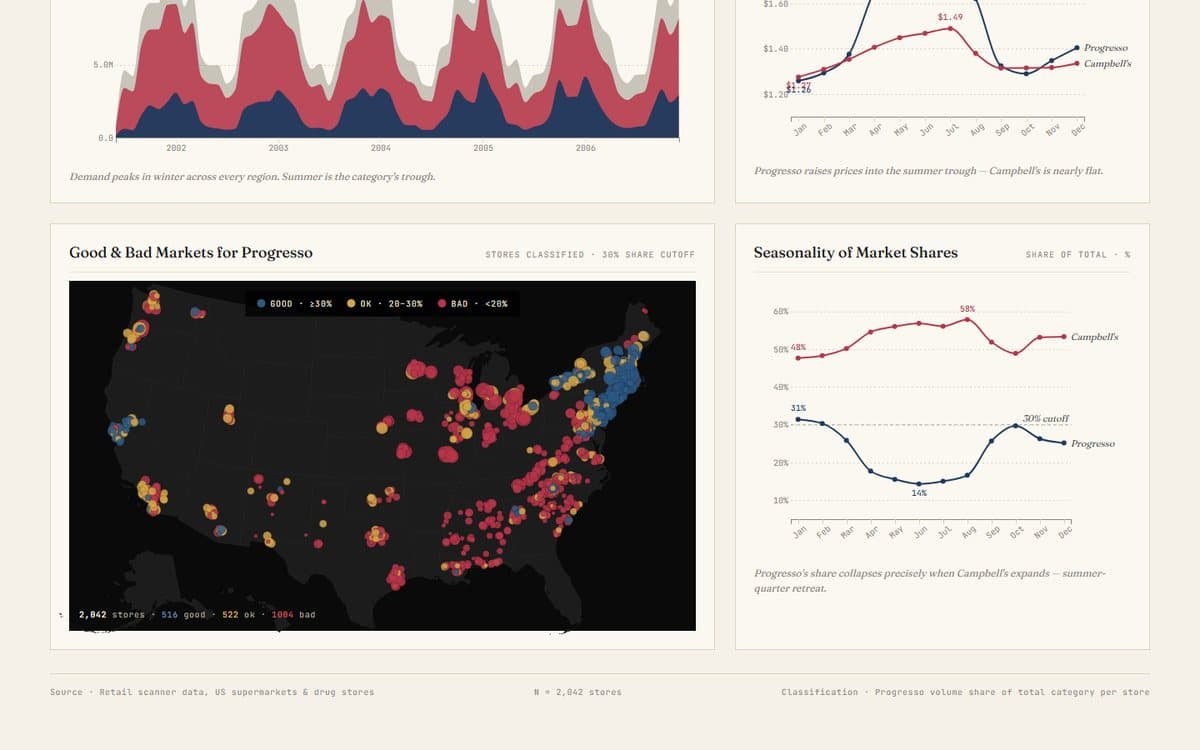
When demand is seasonal and a recession hits, when should a soup brand cut price and when should it hold? Trace promotion, volume, and competitive response across the cycle.
 Teaching
Fast-Food Brand Perceptual Map
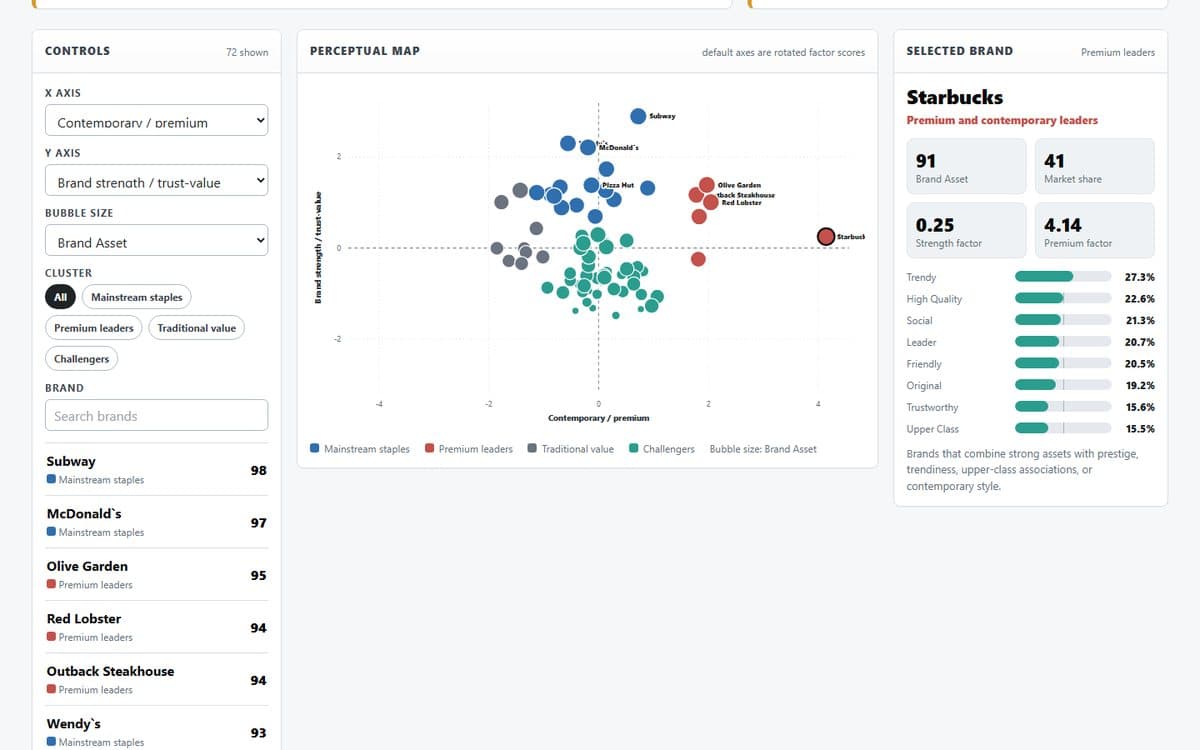
Reduce 48 BAV brand attributes into factor-map axes, inspect loadings, cluster fast-food brands, and test how much Brand Asset follows from the latent perception scores.
Milk field experiment
Store-level milk pricing quasi-experiment data with diet soda placebo, whole milk share, flat-pricing treatment, and ZIP income measures.
 Teaching
NYC Taxi/Ride-Hail: Uber & Lyft at the COVID Emergency
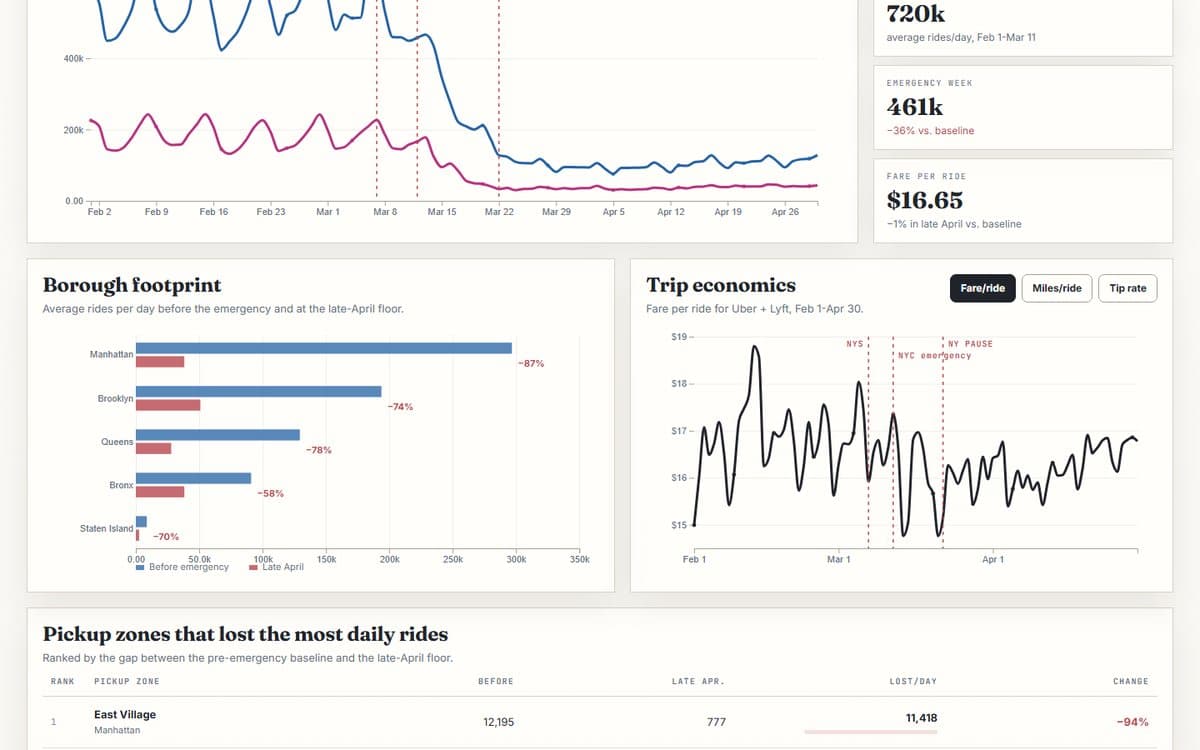
Trace Uber and Lyft rides across NYC pickup zones as demand breaks around the March 2020 emergency declaration, then compare the late-April floor by borough and zone.
Political books review corpus
Amazon-style political and business book reviews with ratings, text, review metadata, product description, category, price, and reviewer fields.
Progresso pricing workbook
Teaching workbook with demand, brute-force price search, solver, analytical pricing, seasonal segmentation, and cross-price interpretation tabs.
Progresso soup scanner data
Store-week style scanner data for Campbell, private-label, and Progresso soup volumes and prices, with store geography and local demographics.
 Teaching
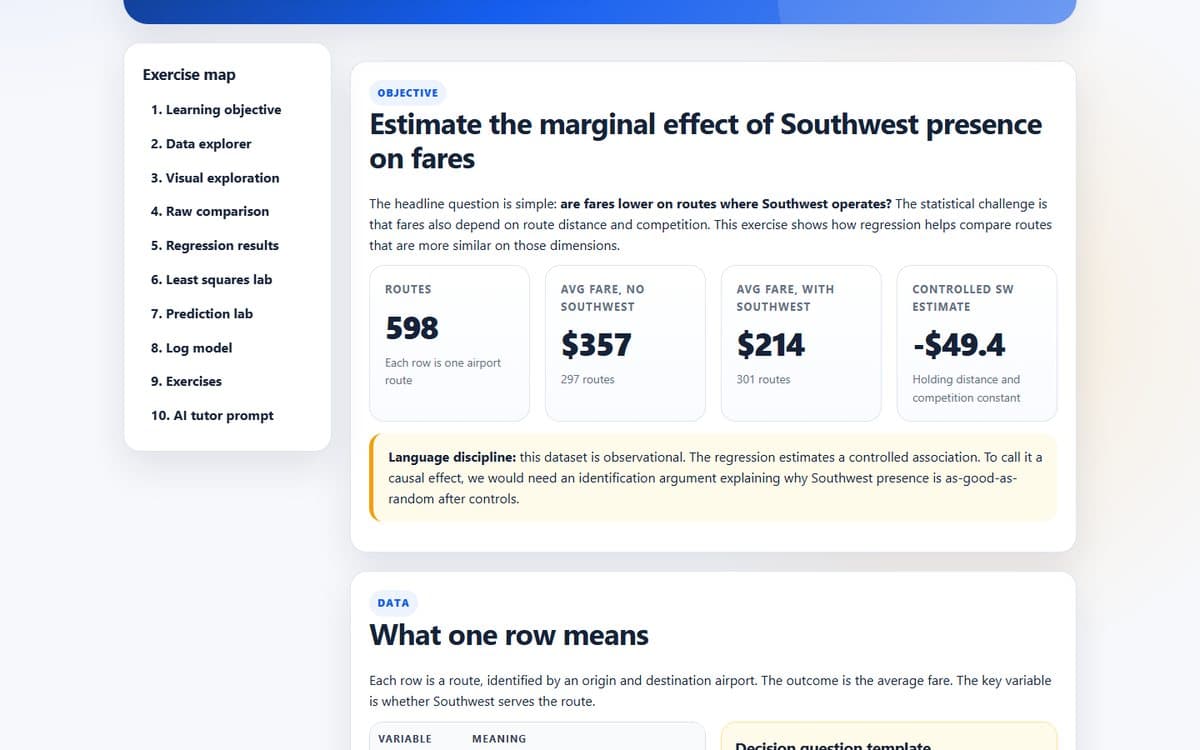
Regression Exercise: Did Southwest Lower Airfares?
The hands-on companion: download the route data, run the regression yourself, and read the coefficients the way a manager would. Built for a live class session.
 Teaching
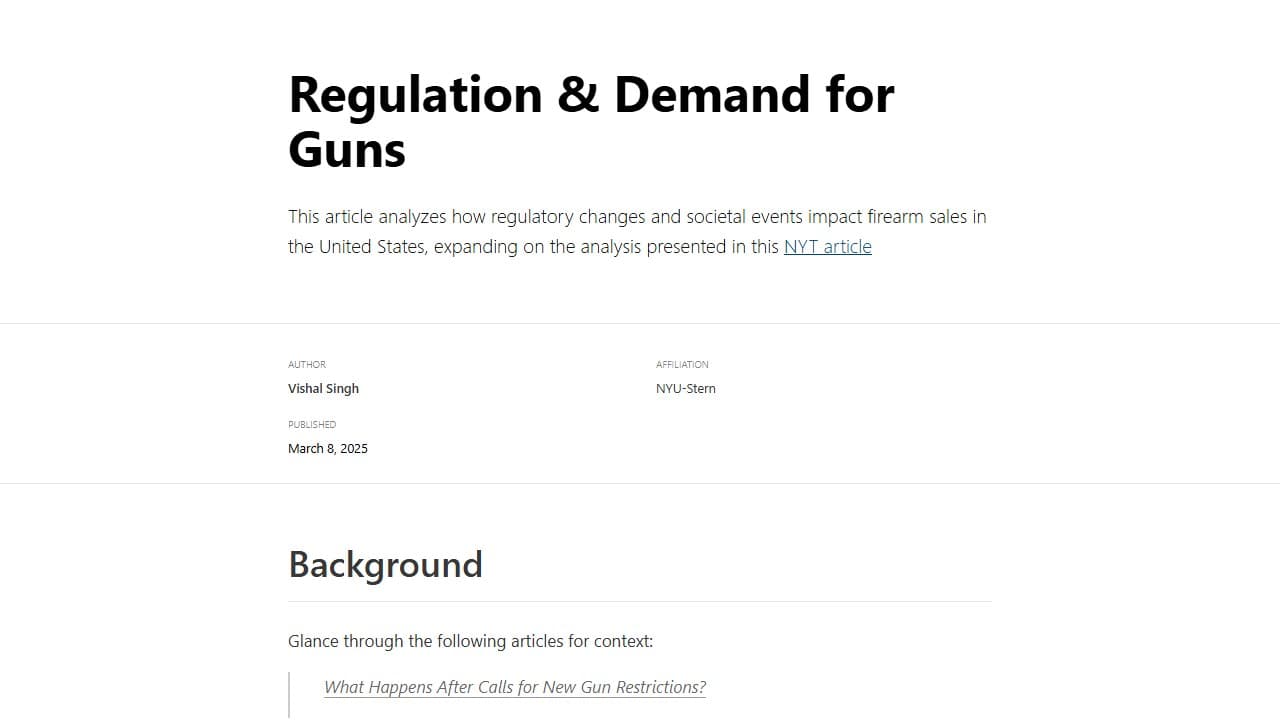
Regulation & Demand for Guns
Analyze FBI background-check data to see how regulatory changes, major events, seasonality, and COVID-era shocks changed U.S. firearm demand across states.
RentHop apartment listings
Apartment listing data with address, hot/not label, coordinates, amenities, bathrooms, bedrooms, and price.
 Teaching
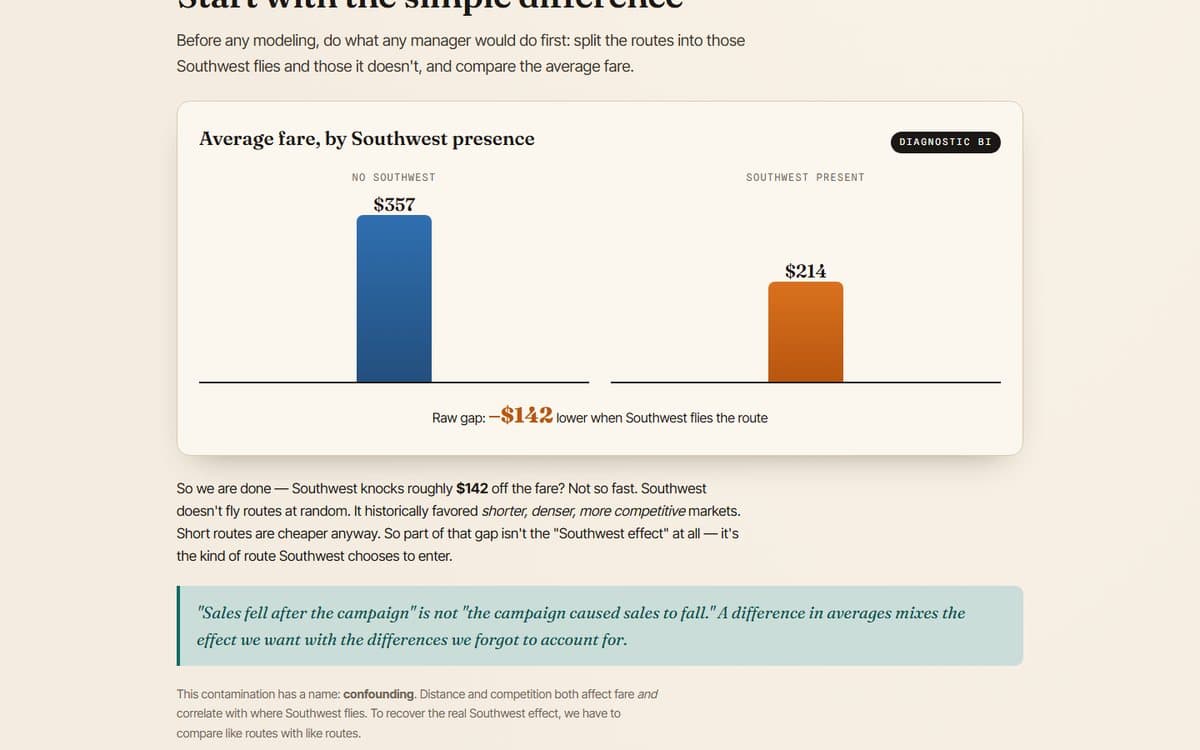
The Southwest Effect
Does a low-cost carrier entering a route really pull fares down — and by how much, once you hold distance and demand fixed? A visual walk through the classic regression.
BAV fast-food brand perceptions
Brand Asset Valuator-style fast-food brand metrics, market share, and attribute perception percentages.
Beer acquisition tweet sentiment corpus
Tweet corpus around beer-brand acquisition events, with text, source, event timing, acquisition period, URL flag, and date fields.
 Teaching
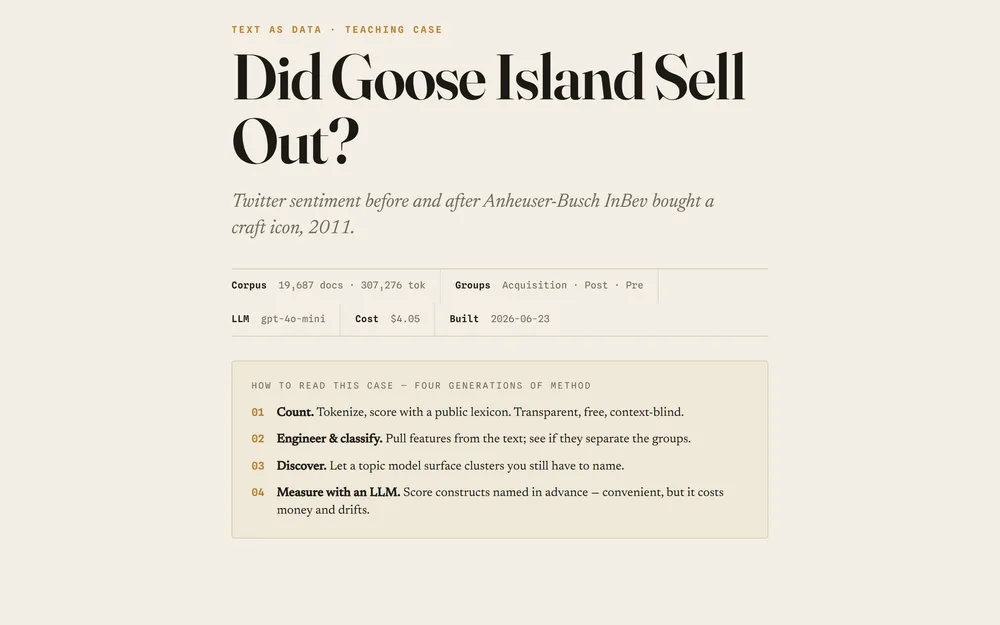
Did Goose Island Sell Out?
On March 28, 2011, Anheuser-Busch InBev acquired Chicago’s Goose Island. This case treats the acquisition as a natural experiment: roughly 20,000 tweets mentioning Goose Island, split into the weeks b
 Teaching
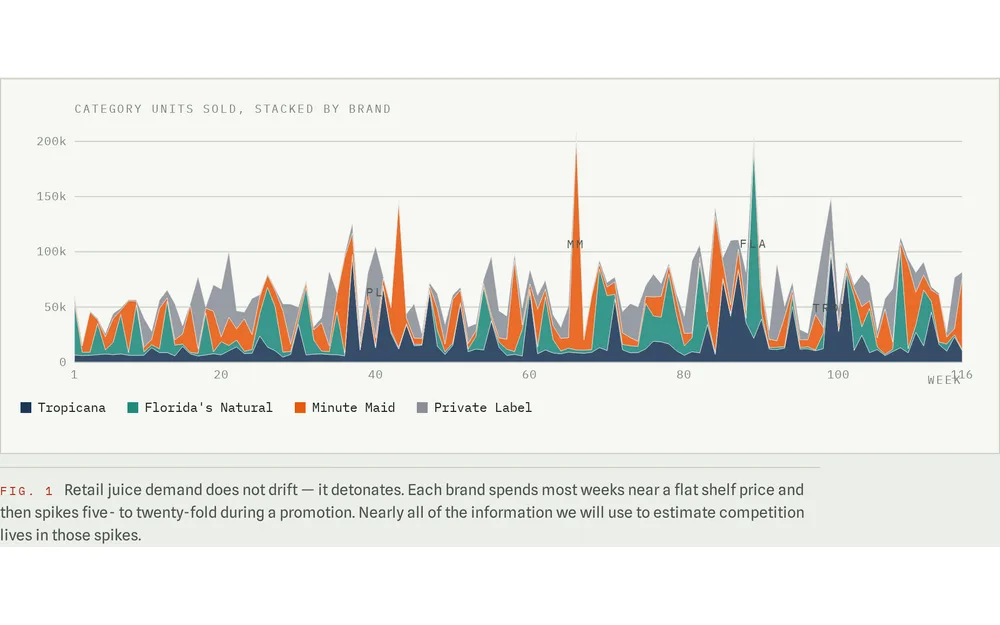
What Your Rival's Price Does to Your Sales — Cross-Price Elasticity
A D3M teaching case: estimating a cross-price elasticity matrix from 116 weeks of orange juice scanner data, and learning to tell a real competitive finding from a rounding error.
 Teaching
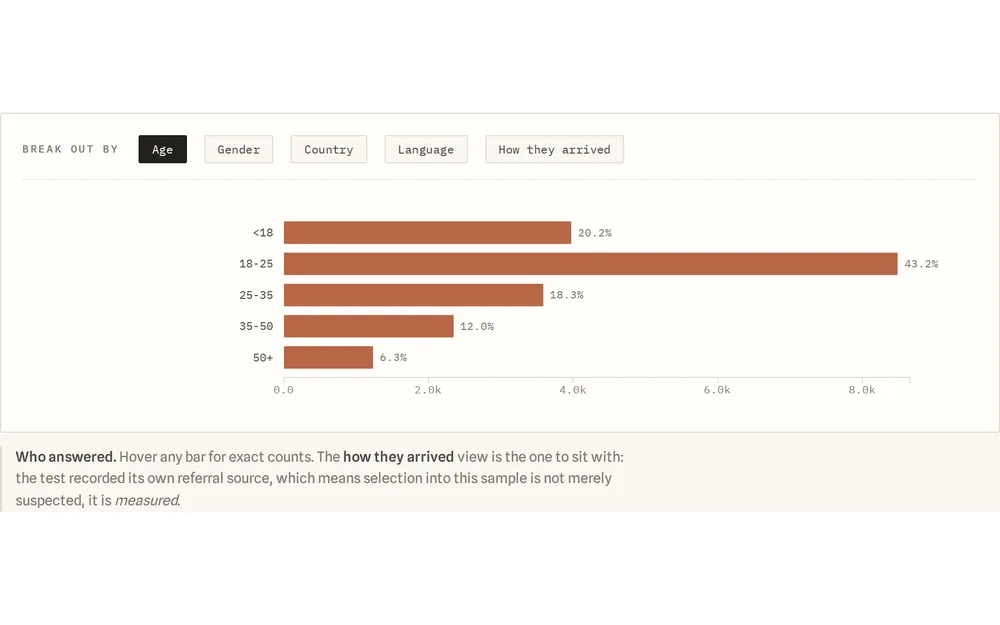
How Many Questions Do You Need? — Factor Analysis and the Cost of a Shorter Survey
Bean & Basket wants to launch a Discovery Subscription — a rotating single-origin coffee delivered monthly, sold as a $45-a-year commitment. The marketing team has a theory about who will buy it: curious people. People who like trying th…