Inequality & Mobility
Income and wealth gaps, economic mobility, and who gets ahead — evidence across places, cohorts, and generations.
7 pieces
 Teaching
The Slope Factory
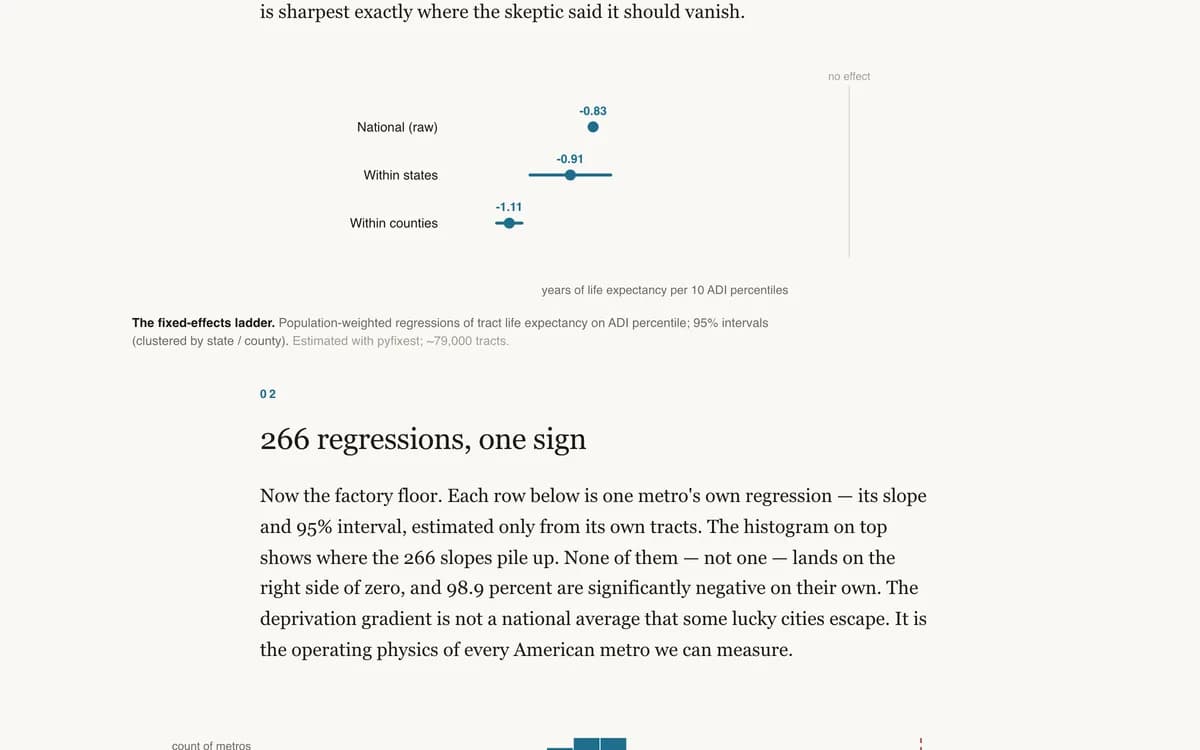
We fit the deprivation–life-expectancy regression separately in 266 American metros. Every single slope came back negative. Many small models, one law.
 Blog
BlogThe Places That Beat the Model
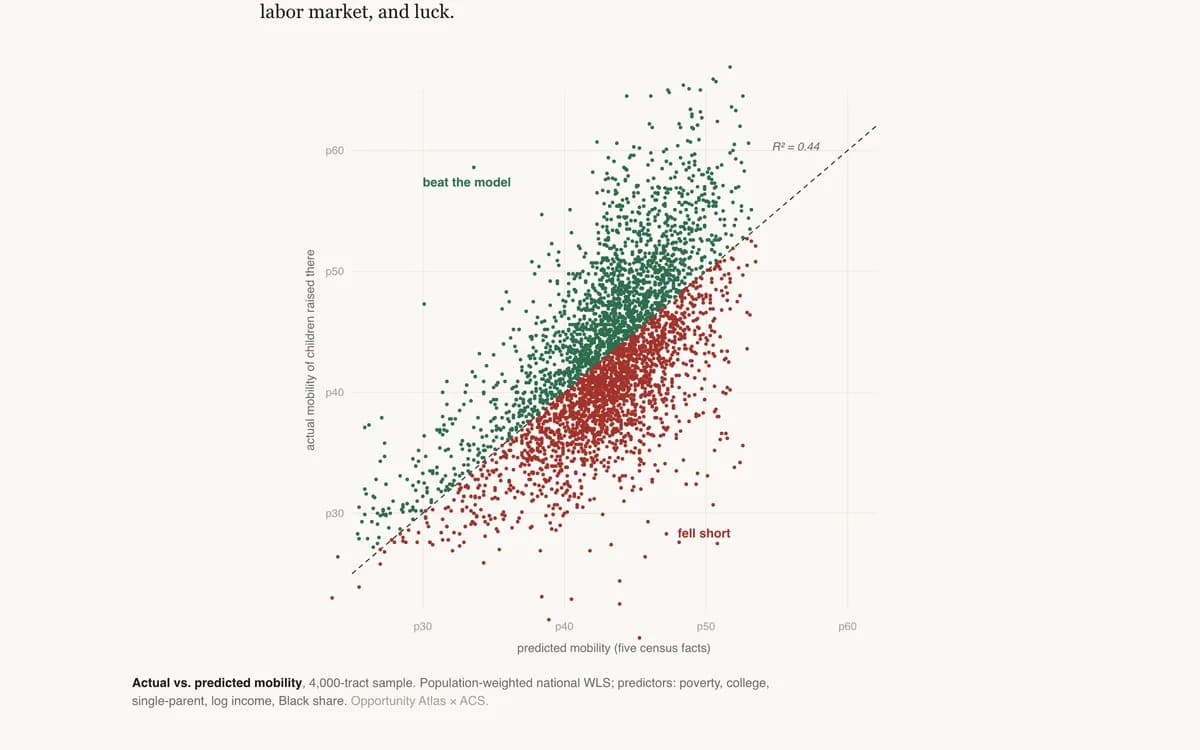
A five-variable model predicts neighborhood mobility with R² = 0.44. The residuals are the interesting part: the counties that out-perform their demographics, and the boomtowns that don't.
 Teaching
An Index Autopsy
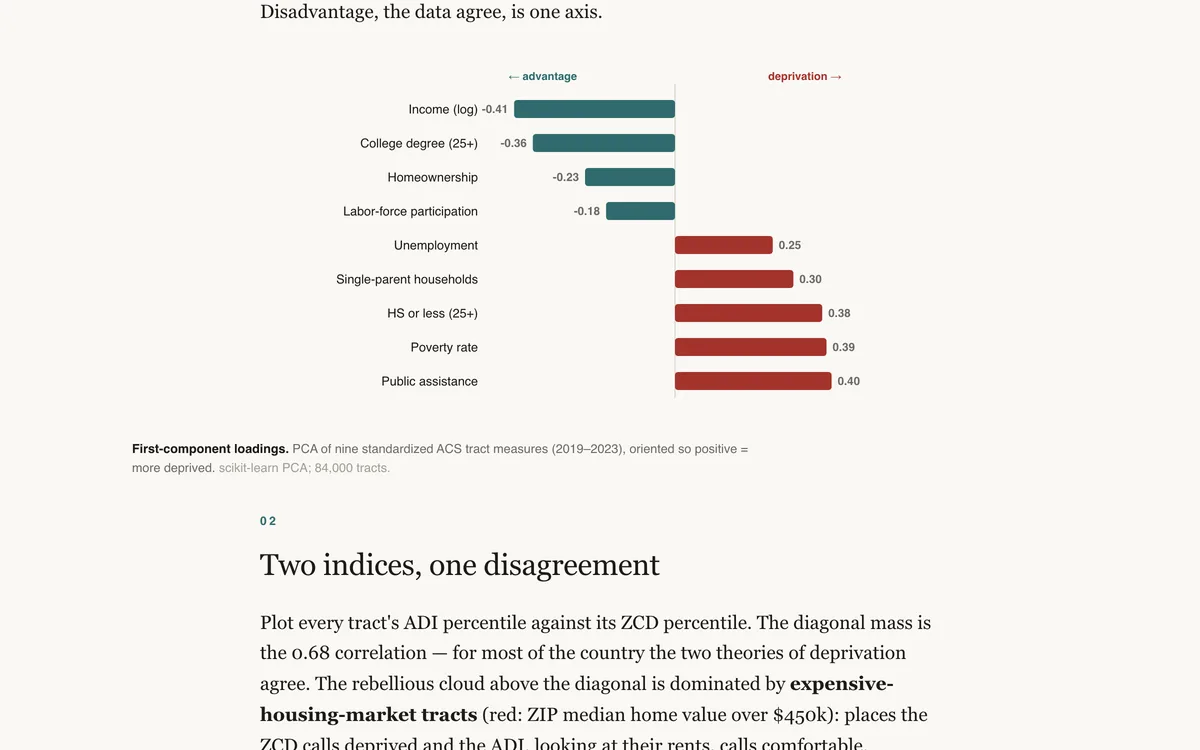
We rebuilt a deprivation index from scratch with PCA — no housing costs — and compared it to the canonical ADI. They agree on the gradient and disagree violently about New York.
 Blog
BlogRaised Poor, Locked Up
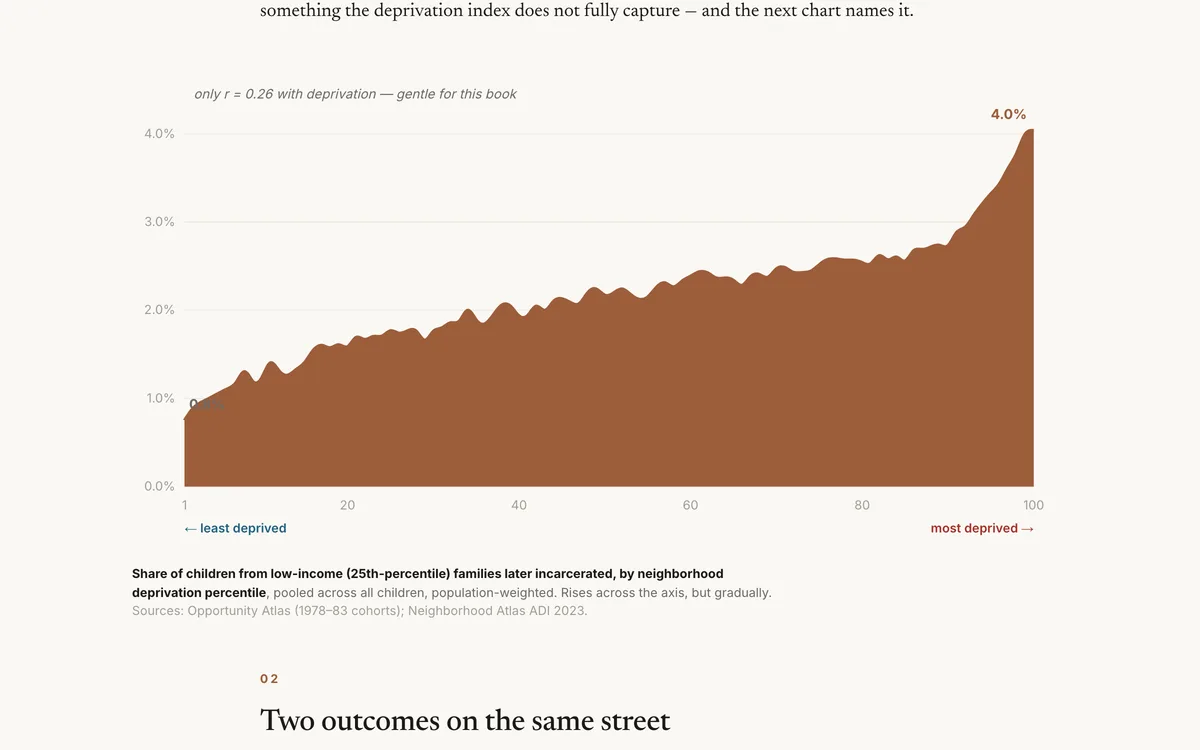
For boys raised by poor families, the odds of growing up incarcerated rise with neighborhood deprivation — and, on the very same streets, fall heavily by race.
 Blog
BlogThe Born-Rich Premium
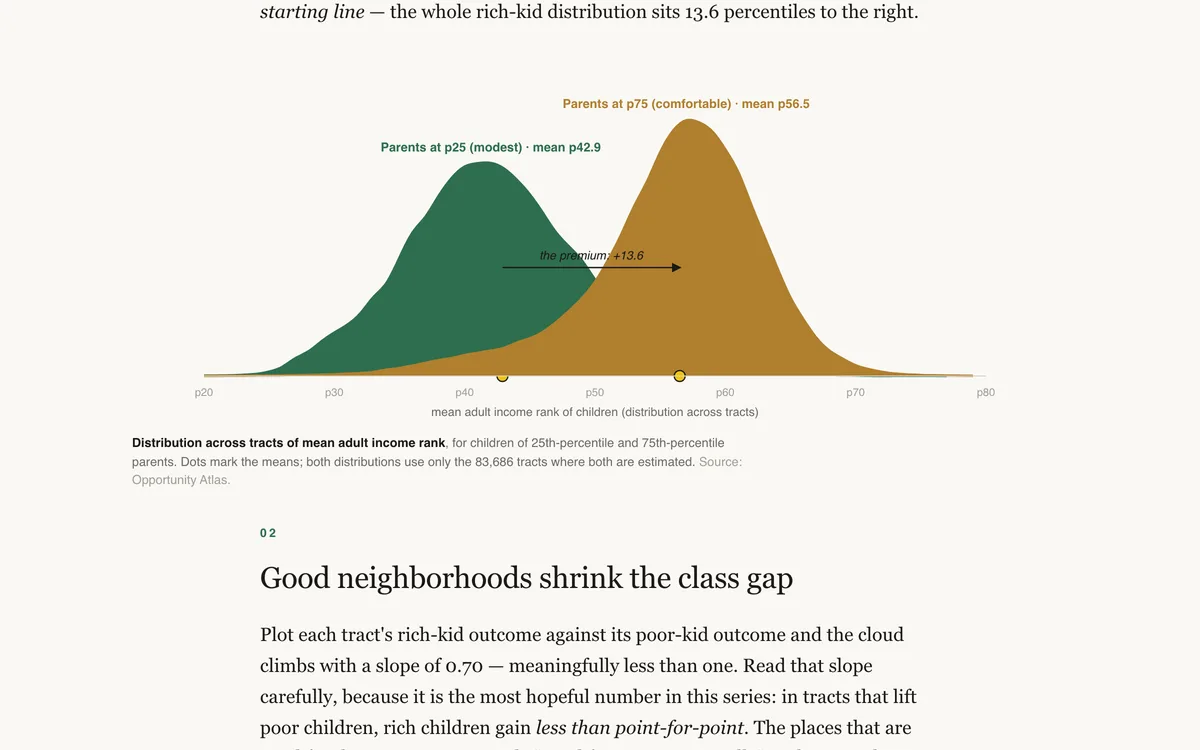
What does a rich birth buy? The Opportunity Atlas prices the class premium neighborhood by neighborhood — and it varies twofold across America.
 Blog
BlogThe Company You Keep
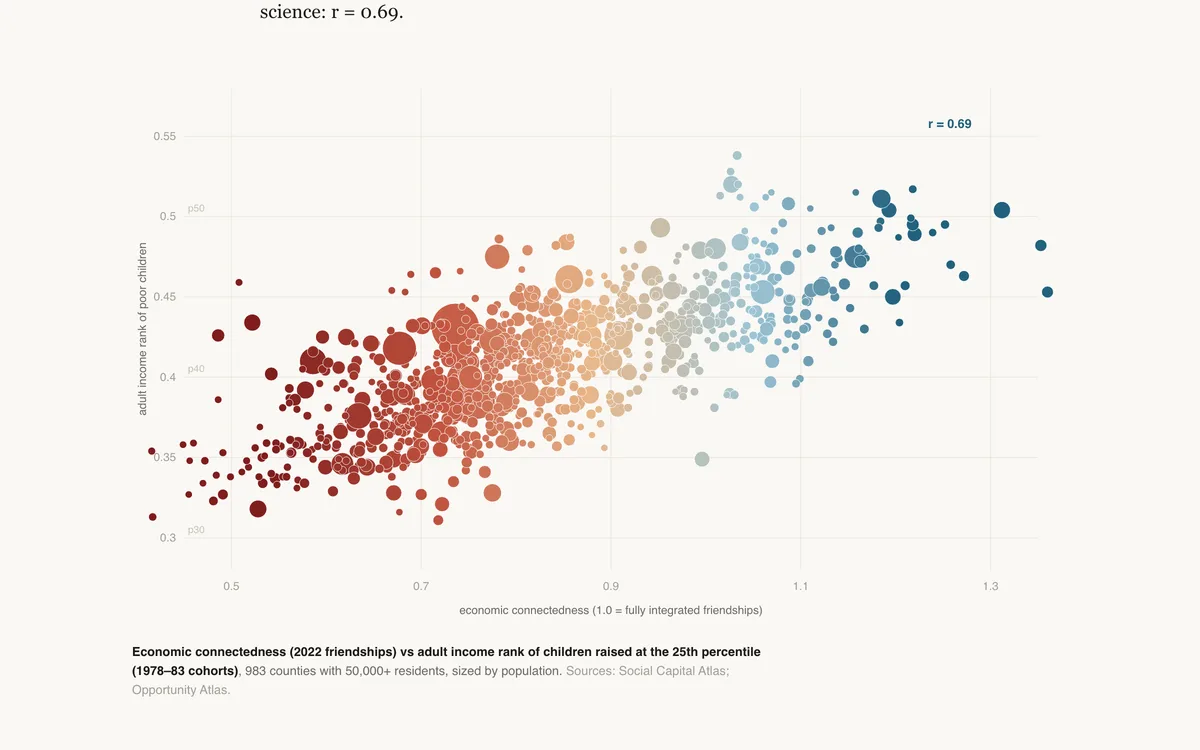
Twenty-one billion Facebook friendships, one question: which kind of social capital actually predicts whether poor children rise? Cross-class friendship does. Volunteering, clubs, and tight-knit networks barely register.
 Blog
BlogThe Starting Line
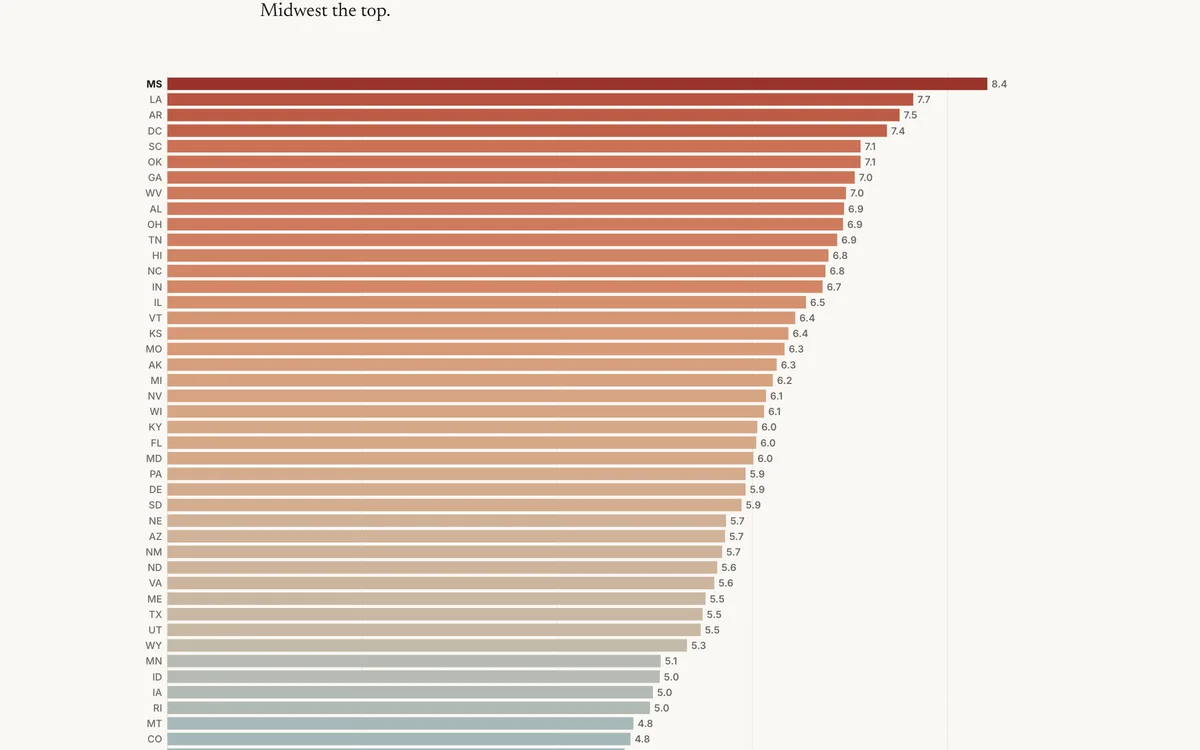
A baby's odds of reaching its first birthday are rationed by county. Infant mortality across the deprivation gradient.