Happiness & Well-Being
Life satisfaction, time use, stress, and social connection — what large surveys reveal about how Americans are actually doing.
21 pieces
 Blog
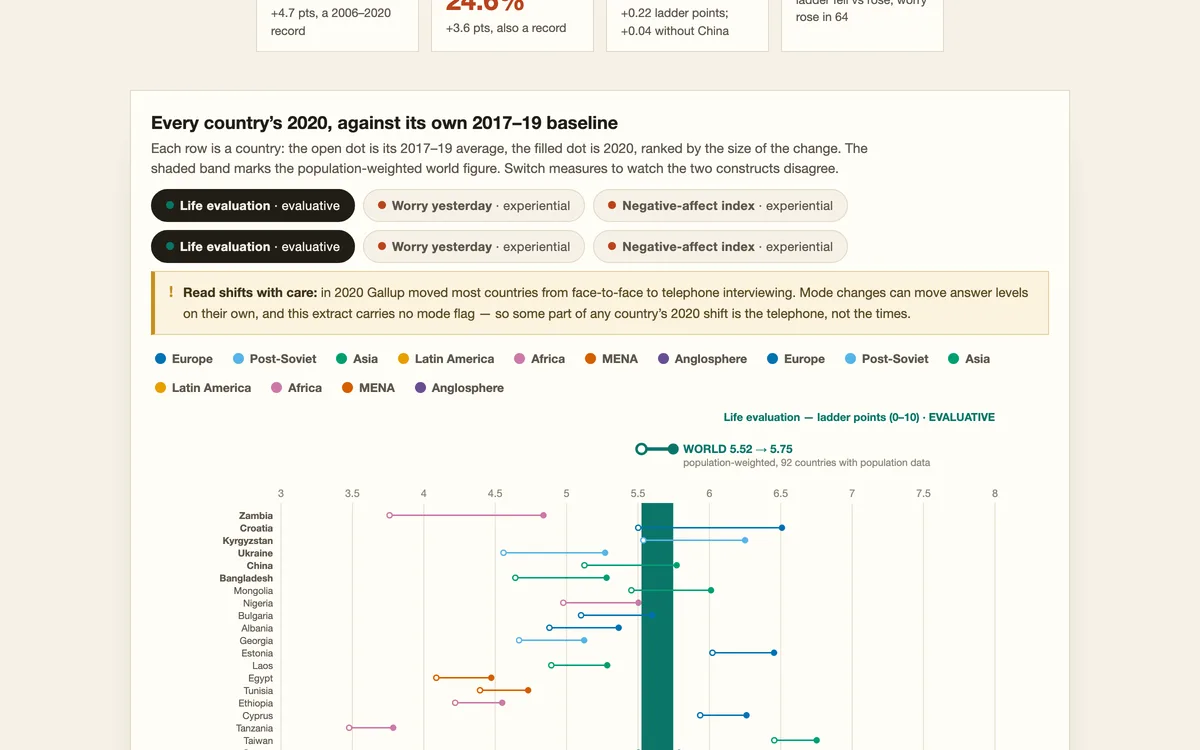
Blog2020: The World's Worst Year?
Gallup World Poll, 93 countries: in 2020 daily worry, sadness and stress hit their highest recorded levels, while the world’s rating of its own life barely moved.
 Blog
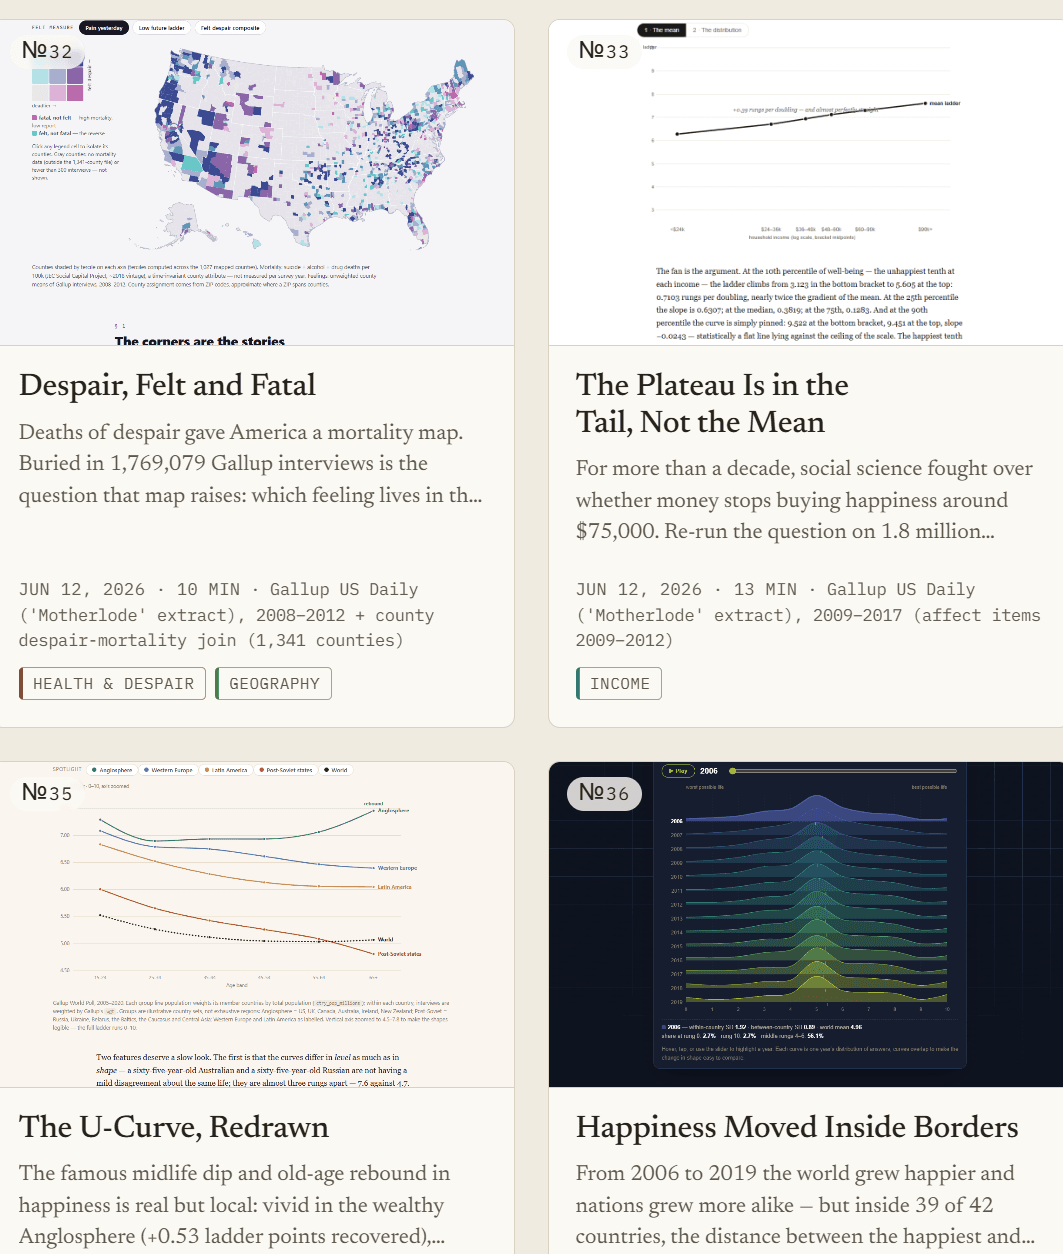
BlogThe Well-Being Atlas
A publication of reproducible data essays on life satisfaction — Gallup World Poll, GSS, and WVS microdata across 50 years and 168 countries.
 Blog
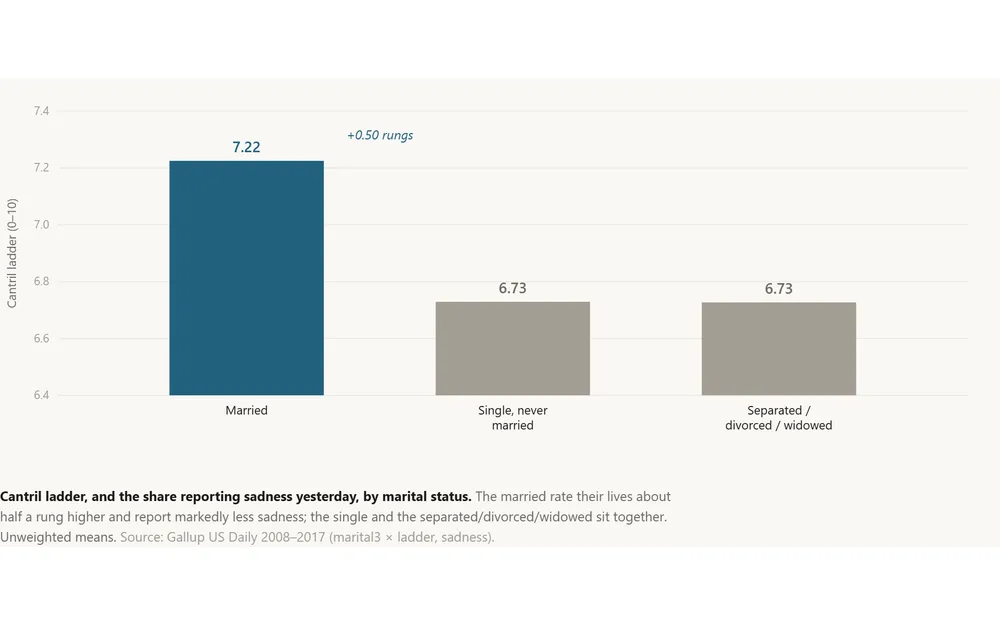
BlogAlone Together
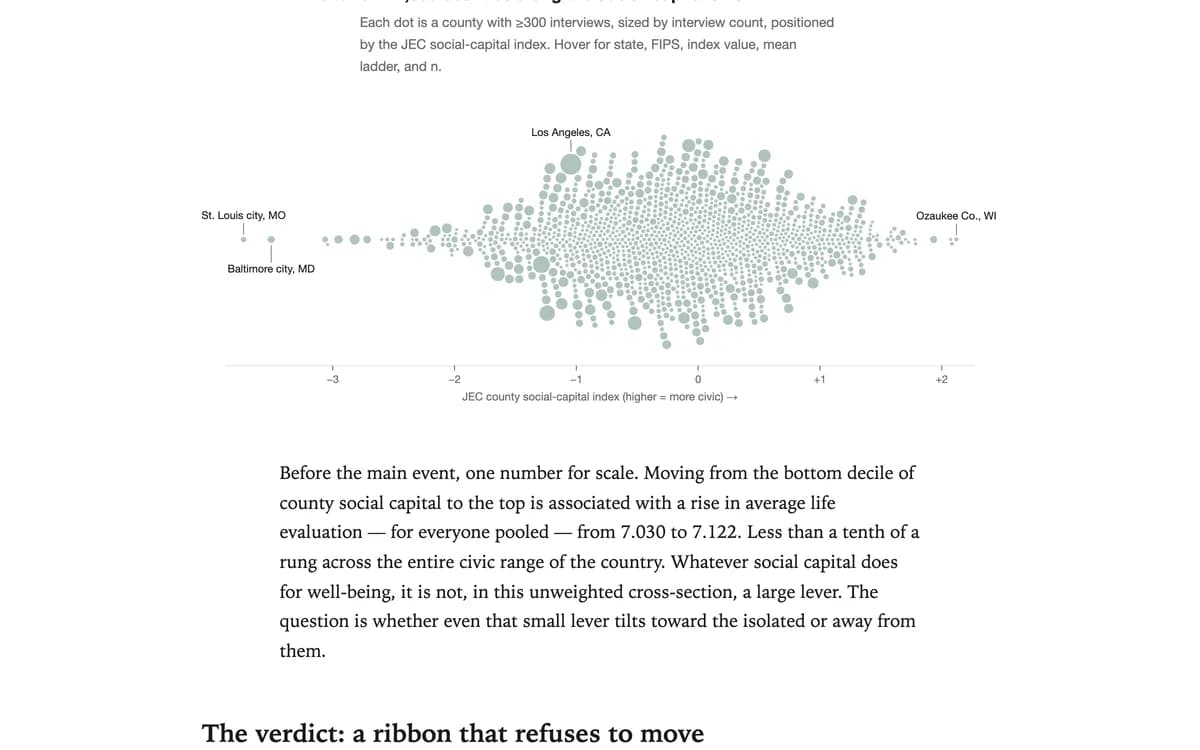
A partner is worth about half a rung of the Cantril ladder, and the premium survives wherever you live. But a civic-rich county does not rescue the isolated — the married-vs-unmarried gap is the same in high-social-capital places and low…
 Blog
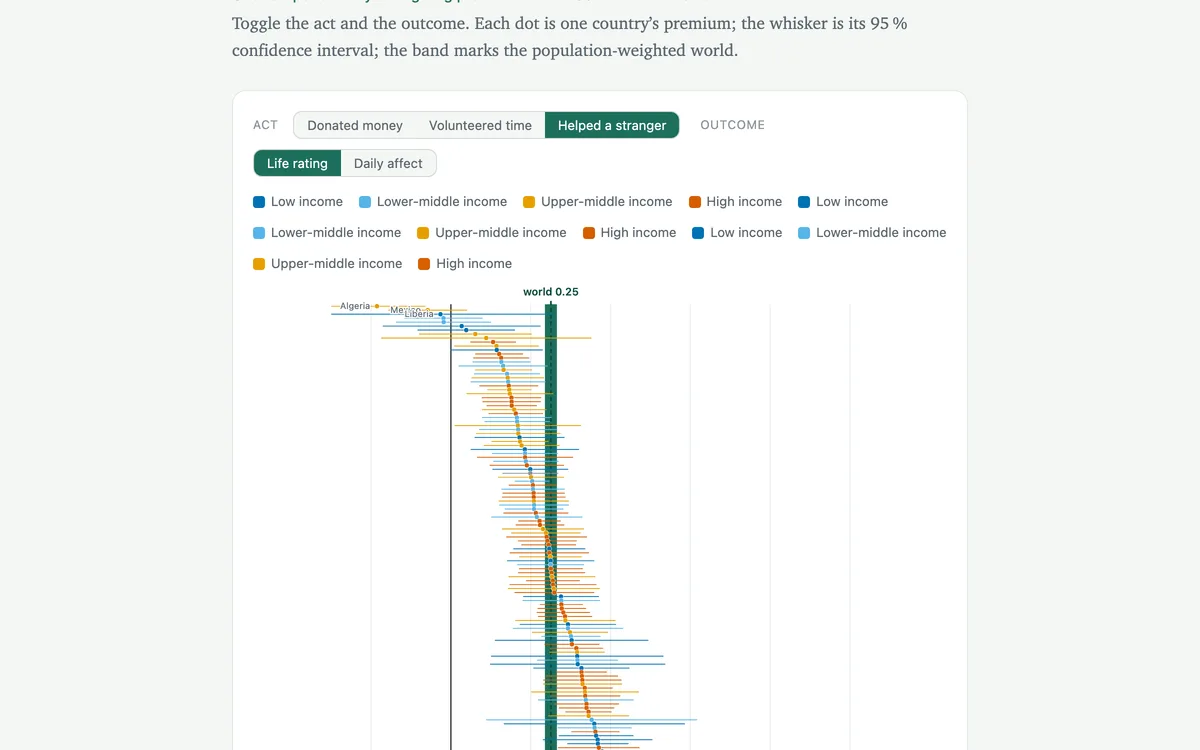
BlogDoes Generosity Pay - Everywhere?
Across 155 countries, people who give — money, time, or a hand to a stranger — rate their lives higher and feel better day to day. The link is remarkably stubborn: it holds in rich countries and poor ones alike, and it is strongest for g…
 Blog
BlogDoes the Ring Still Matter?
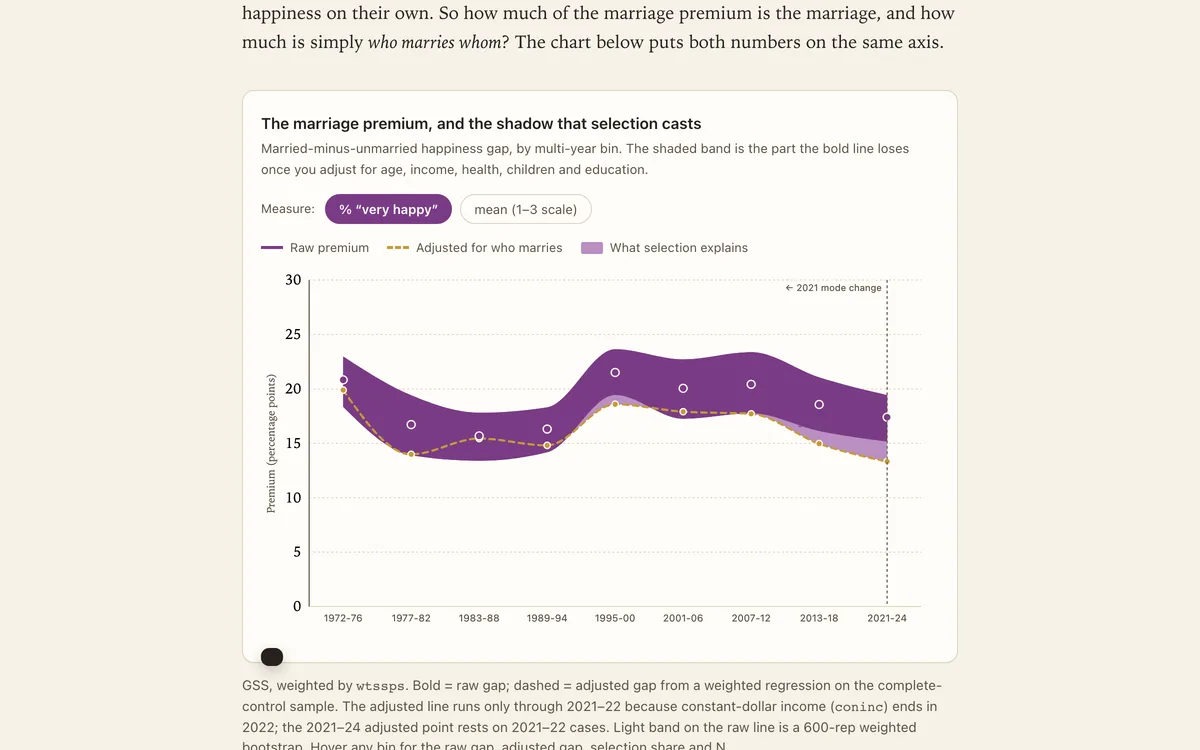
For fifty years, married Americans have reported being happier than everyone else. The gap has barely budged — and most of it survives even after you account for who tends to marry.
 Blog
BlogDoes Community Substitute for Connection?
Putnam's heirs promised that civic fabric lifts everyone. Three and a half million Gallup interviews ask the sharper question: does it lift the people who need it most?
 Blog
BlogHappiness Moved Inside Borders
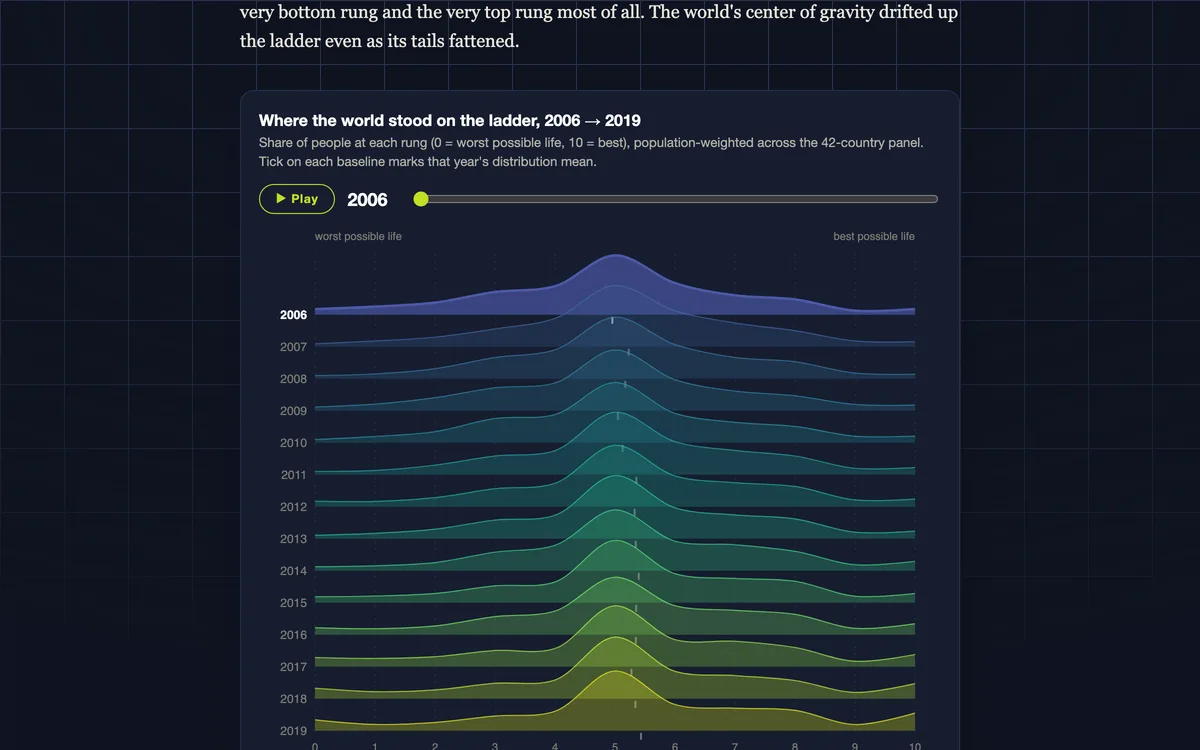
Gallup World Poll, 2006–2019: the world got happier and nations grew more alike, while the gap between each country’s happiest and unhappiest people widened.
 Blog
BlogKeeping Up With the County
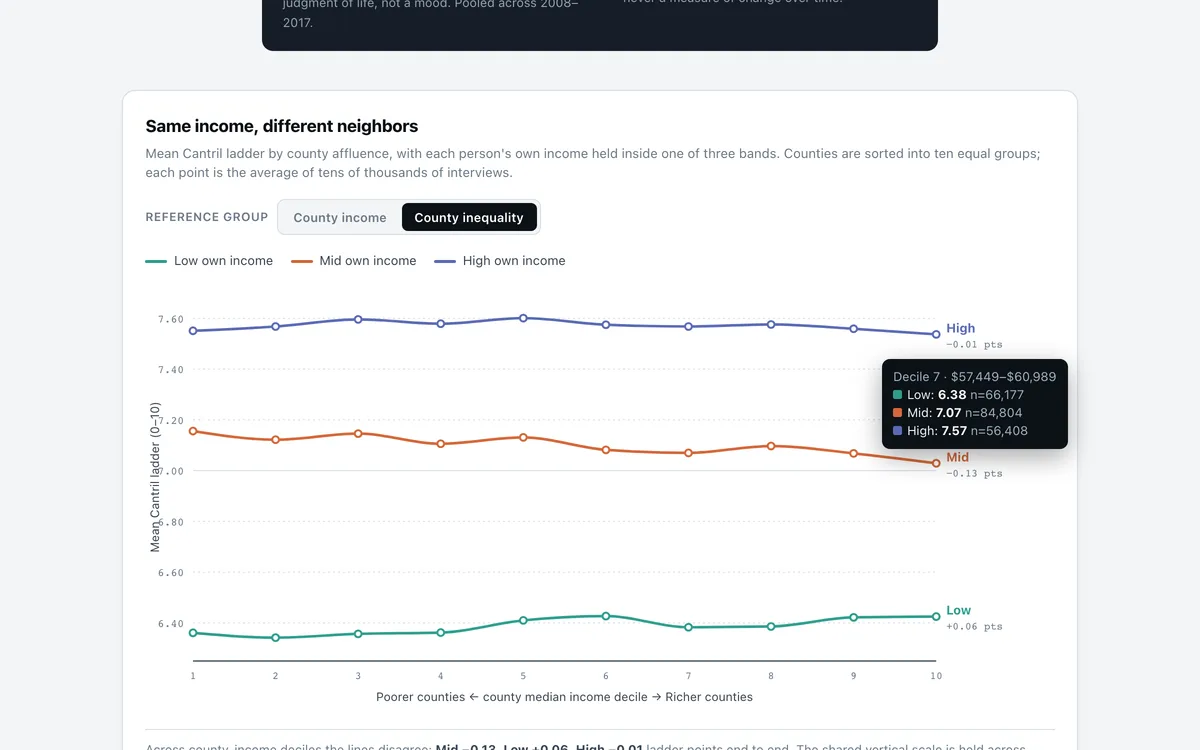
Same paycheck, richer neighbors: across 2.1 million Gallup interviews, living among wealthier people lowers life evaluation for the middle and barely touches the rich — while the poor are unbothered or slightly lifted. Who feels the comp…
 Blog
BlogOut of Place — The Geography of the LGBT Well-Being Gap
Across 62,193 Gallup respondents who said they were LGBT, daily worry, sadness and stress run high everywhere — but how poorly people rate their lives widens as the county turns Republican and rural. And in those same hostile places, far…
 Blog
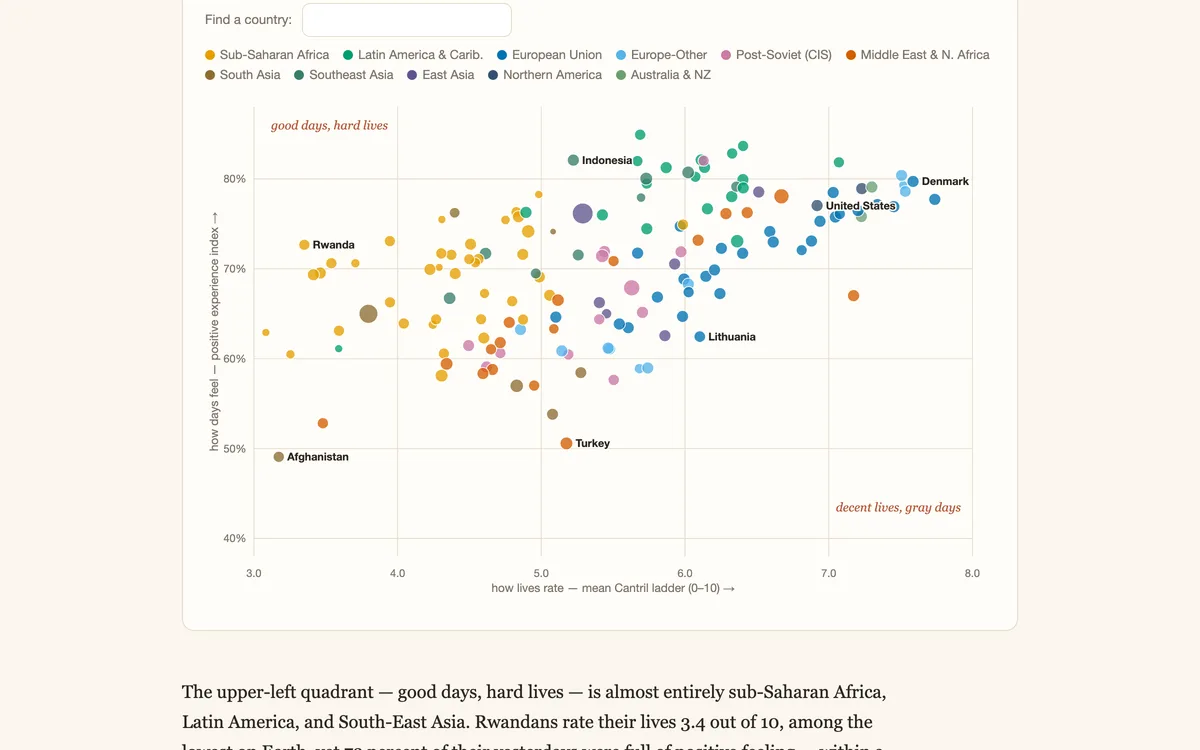
BlogSmiles and Ladders: Where Good Days and Good Lives Come Apart
Rwanda has some of the world's best days and its worst self-rated lives. Lithuania, the reverse. A map of where good days and good lives come apart.
 Blog
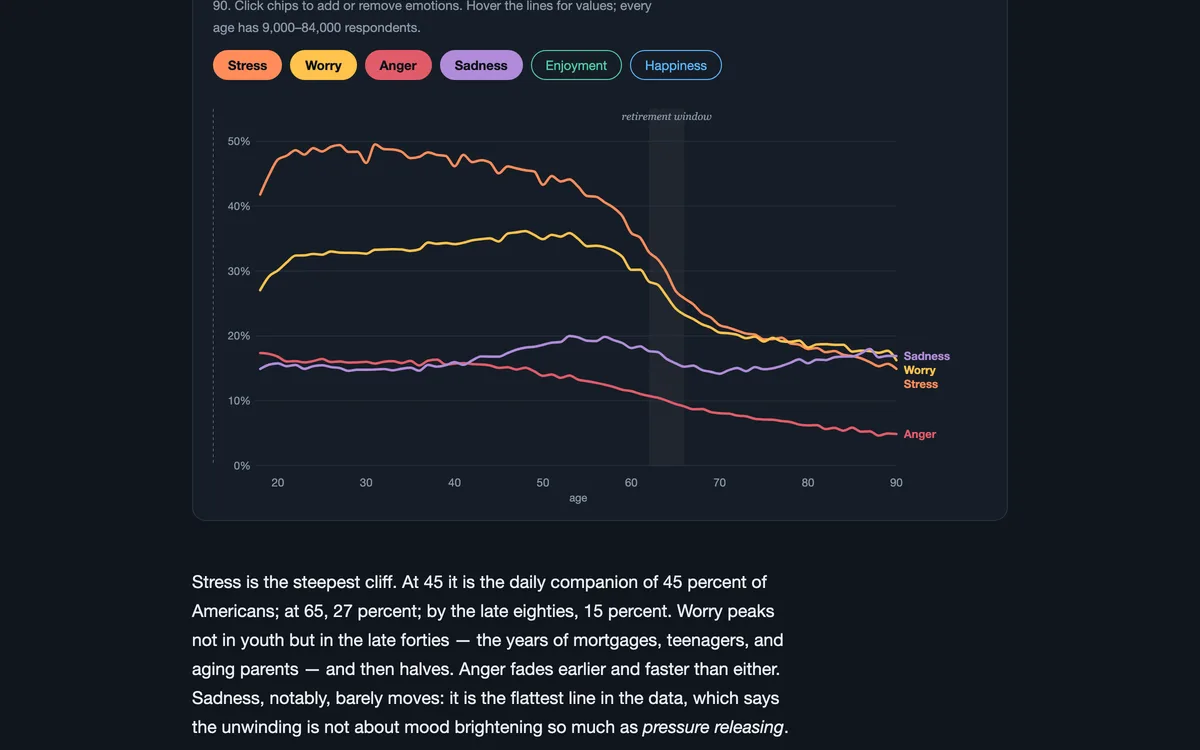
BlogThe Great Unwinding: Stress Is the Only Emotion with a Retirement Party
Between 55 and 70, the emotional weather of American life transforms: stress collapses, worry recedes, enjoyment returns. Stress, it turns out, is the only emotion that gets a retirement party.
 Blog
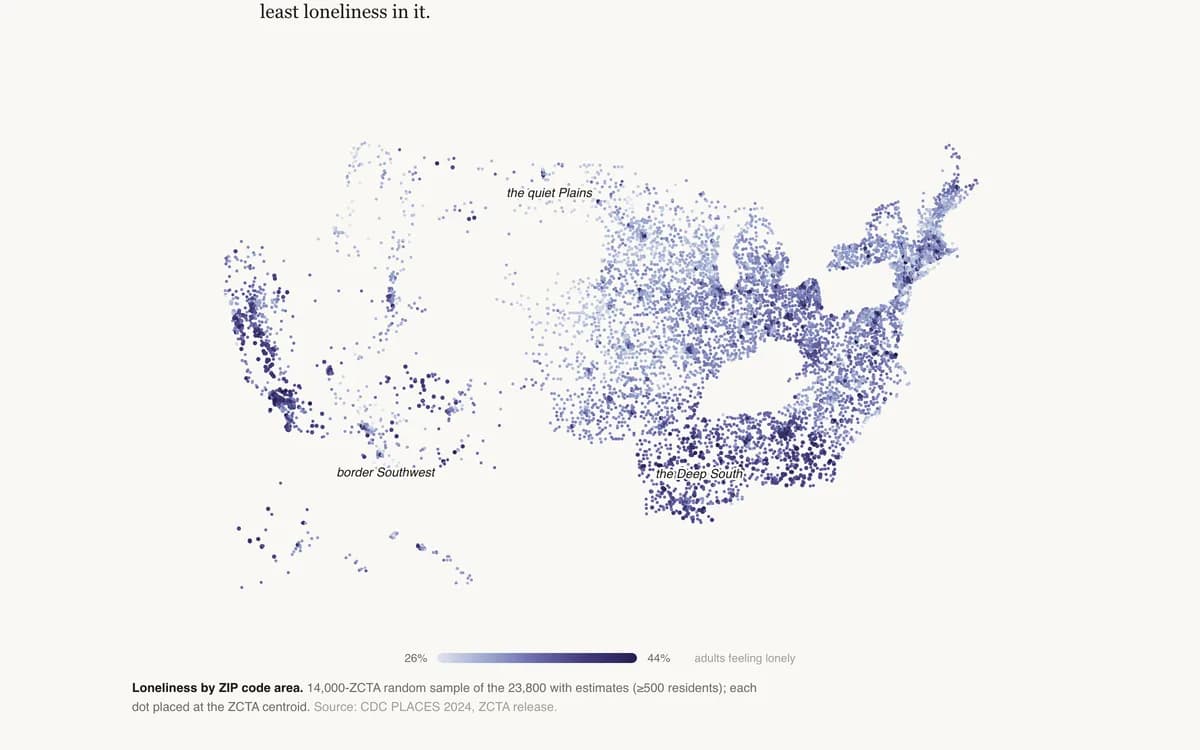
BlogThe Loneliness Geography
Loneliness and depression have opposite geographies: one is young, single, and urban; the other is rural and deprived. A ZIP-code-level map of American isolation.
 Blog
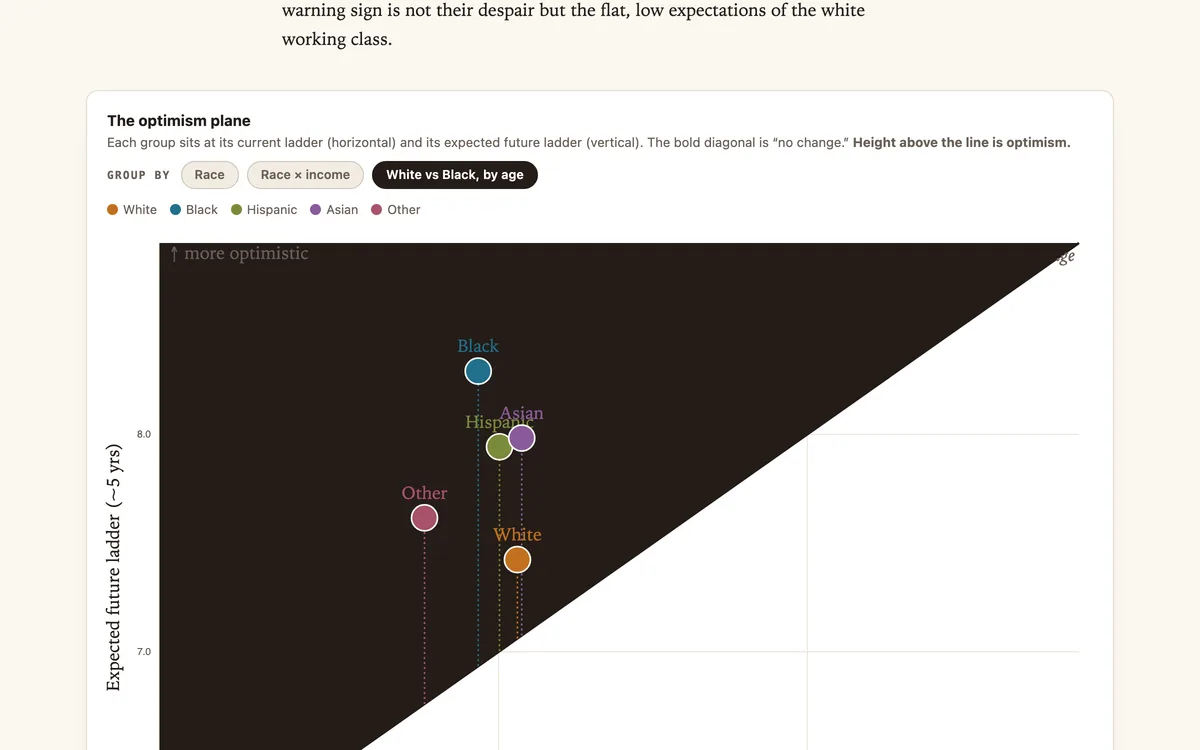
BlogThe Optimism Gap
Across 2.46 million Gallup interviews, Black Americans expect their lives to rise far more than white Americans do at every income level — and the gap is widest among the poor, even though white Americans rate their current lives higher.
 Blog
BlogThe Paradox That Didn't Hold
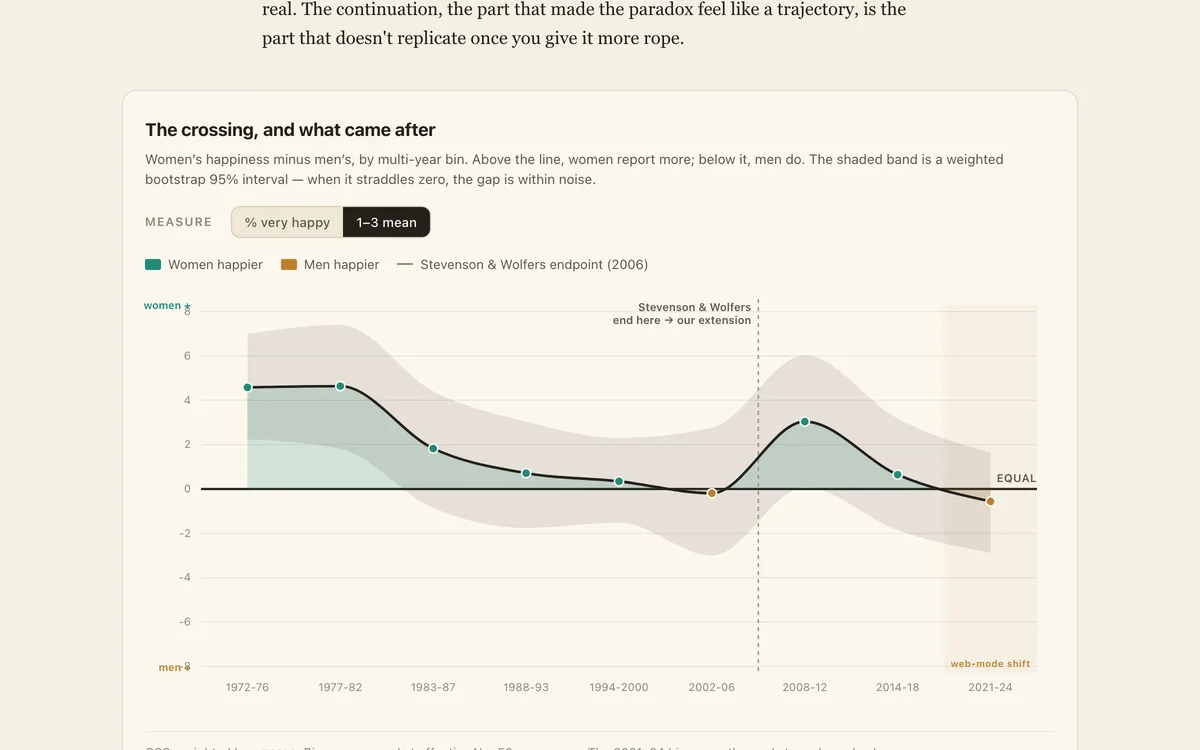
In the 1970s American women called themselves happier than men. A famous study watched that lead vanish. Extend the data eighteen more years and the decline doesn't continue — it dissolves into noise.
 Blog
BlogThe Plateau Is in the Tail, Not the Mean
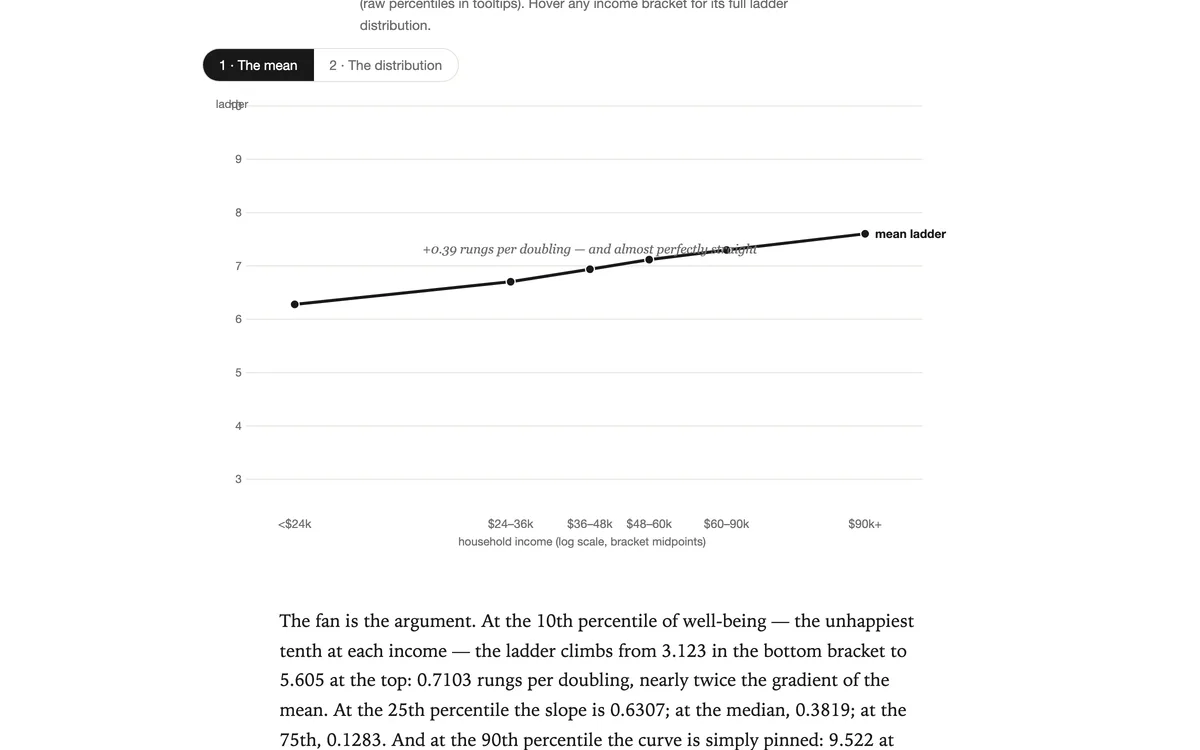
The legend that money stops buying happiness at $75,000 was computed on this very survey. Plot the whole distribution of well-being instead of its average, and the plateau moves: it belongs to the unhappiest Americans — and to feelings,…
 Blog
BlogThe Stress Decade: How the World's Days Got Heavier, 2008–2019
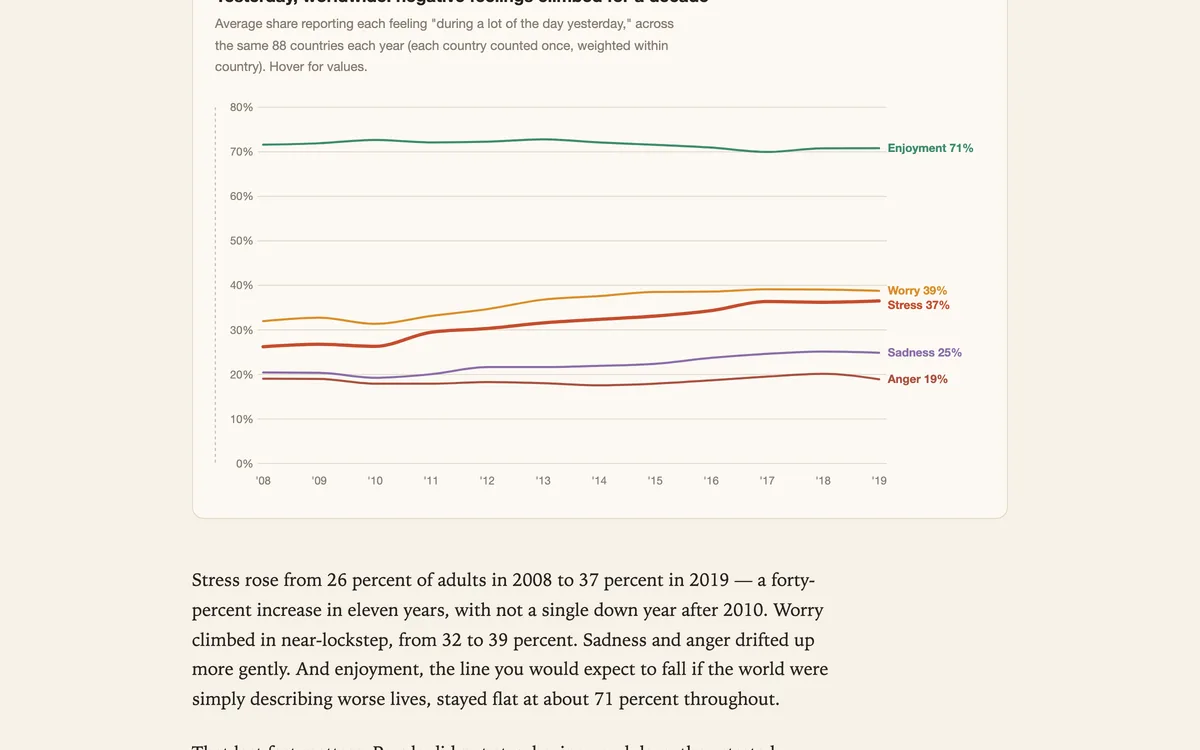
Between 2008 and 2019 — before anyone had heard of COVID-19 — the share of humanity reporting a stressful day rose by ten percentage points. Enjoyment never moved.
 Blog
BlogThe Thin Cushion: Money Softens Few of Life's Blows
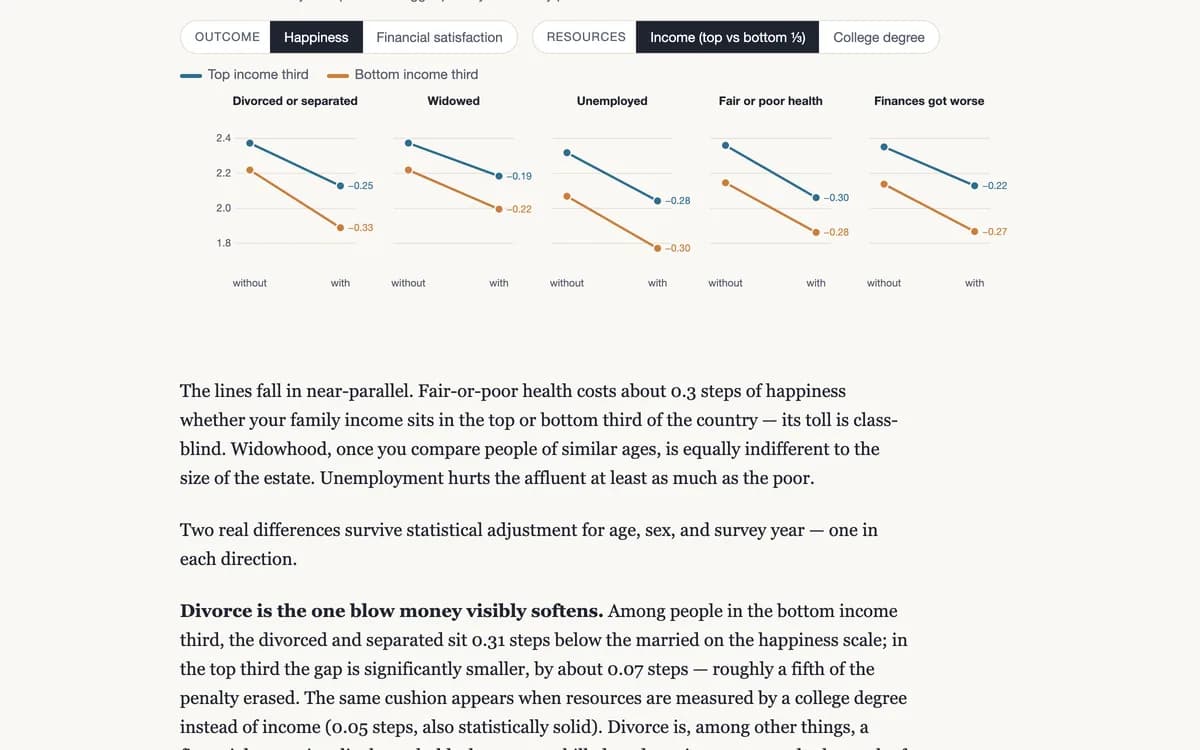
Fifty years of American survey data say wealth softens remarkably few of life's blows — and for some, the well-off fall further.
 Blog
BlogThe Two Clocks of Growing Old — what ageing does to a day, around the world
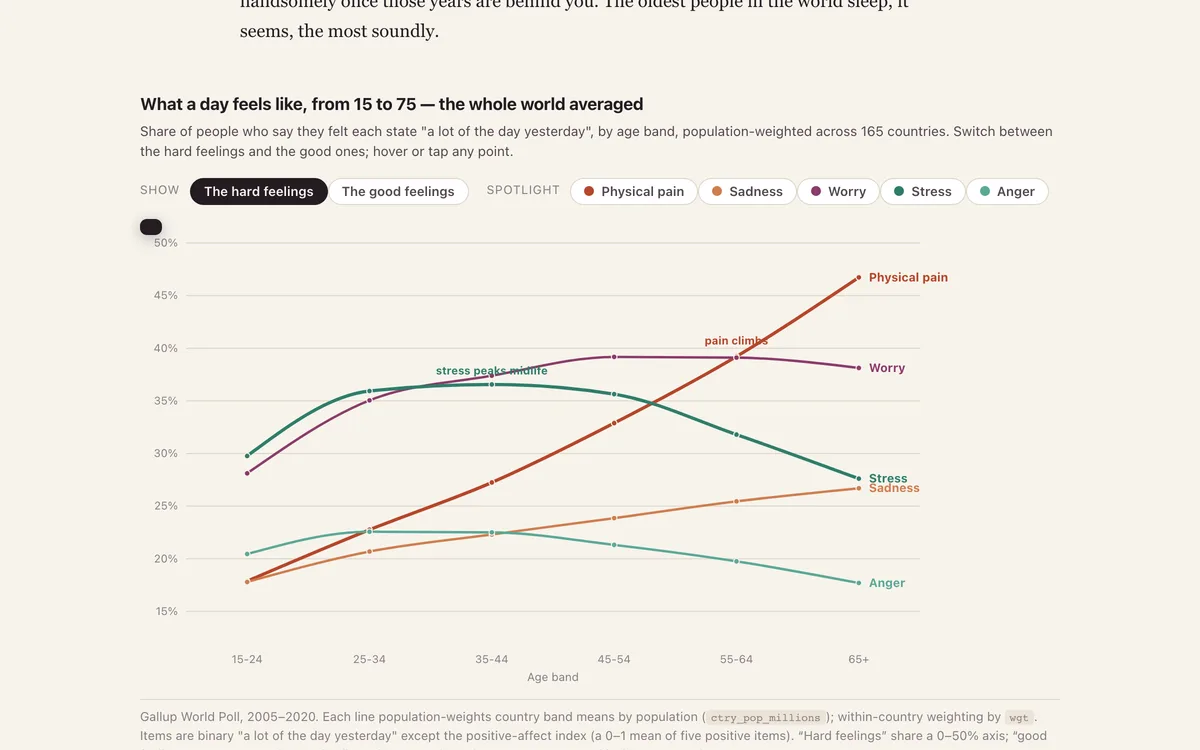
Gallup World Poll, 2005–2020, 2.3 million interviews in 165 countries: as people age, the mind’s agitations — stress, anger — fall to lifetime lows, while pain, sadness and the body’s limits climb. And whether old age is calm or anxious…
 Blog
BlogThe U-Curve of Happiness Is Breaking — at the Young End
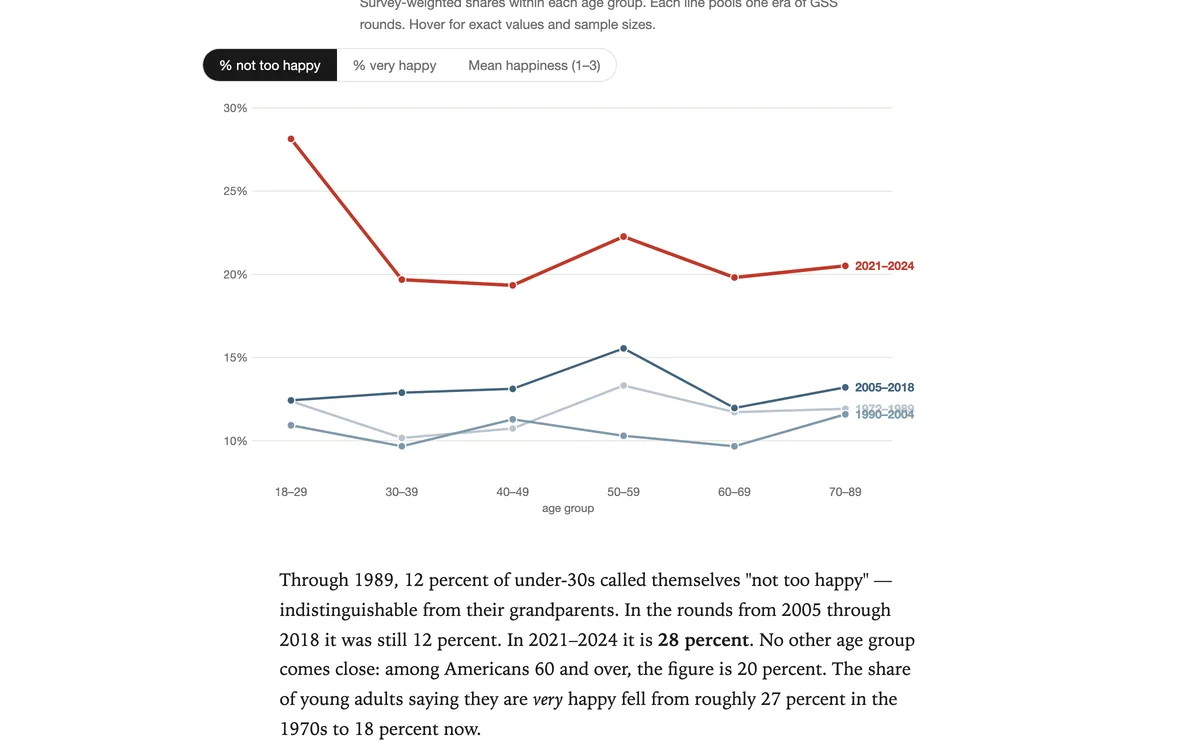
For two generations, happiness sagged in midlife and recovered with age. In the 2020s the curve snapped at its left end: the young are now the unhappiest Americans.
 Blog
BlogThe U-Curve, Redrawn — where the midlife dip in happiness exists, and where it doesn't
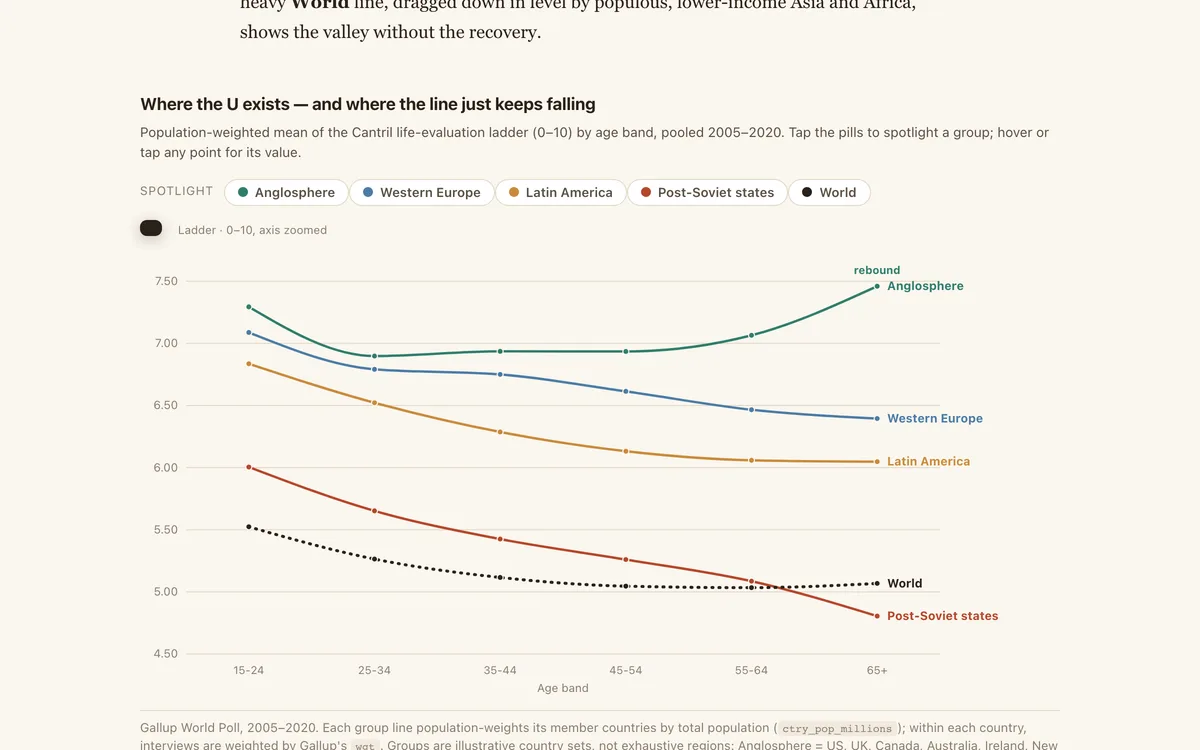
Gallup World Poll, 2005–2020, 2.2 million interviews in 156 countries: the famous U-shaped happiness curve — high in youth, low at midlife, rising again in old age — is real, but mostly a privilege of the rich Anglosphere. Across much of…
 Blog
BlogWhose America Is Thriving? Whoever Just Won.
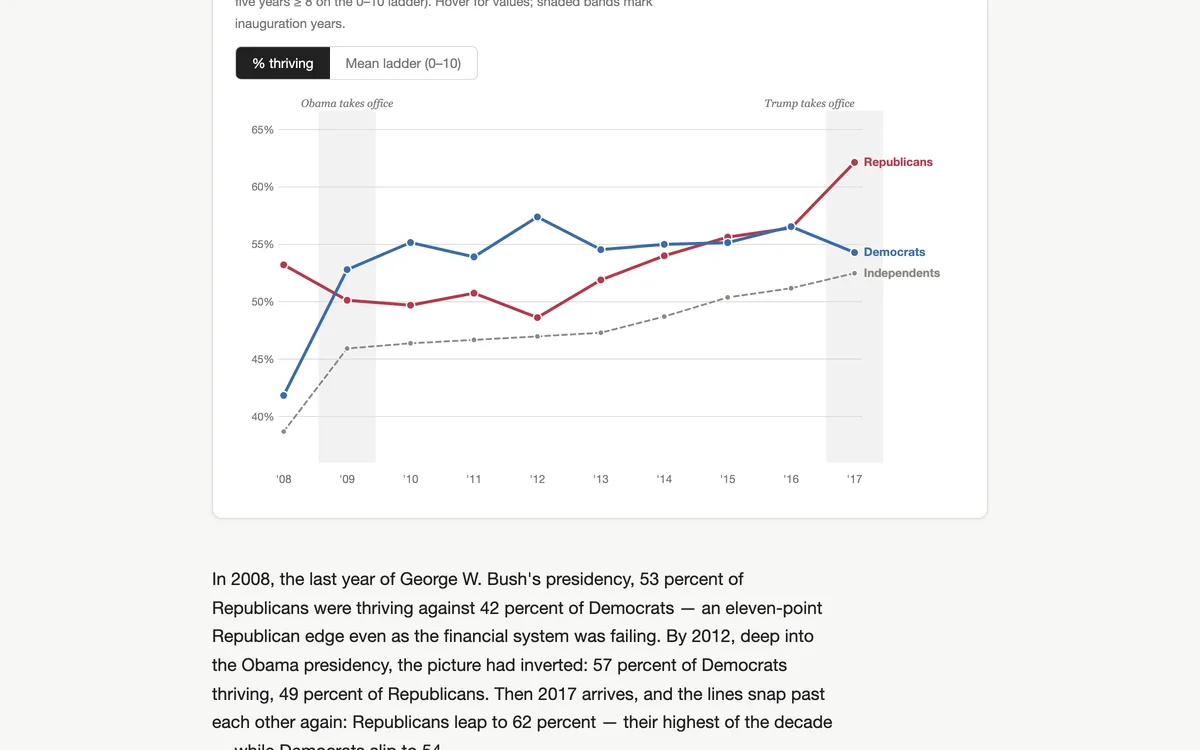
Ten years and 3.5 million interviews show partisans' life evaluations crossing twice — once when Barack Obama took office, and again, in the opposite direction, when Donald Trump did.