Polarization & Public Opinion
Party sorting, attitude gaps, and long-run survey trends — how American opinion divides, shifts, and hardens across groups and decades.
17 pieces
 Blog
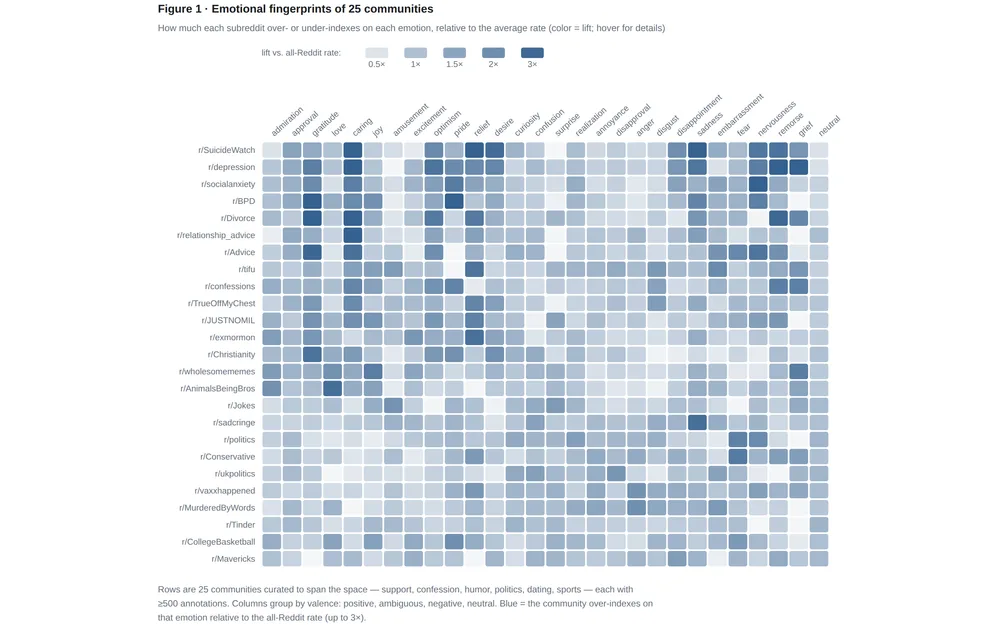
BlogCommunities Have Emotional Fingerprints
211,225 human judgments of Reddit comments reveal that communities run on distinct emotions — and that humans can't agree on what grief looks like.
 Blog
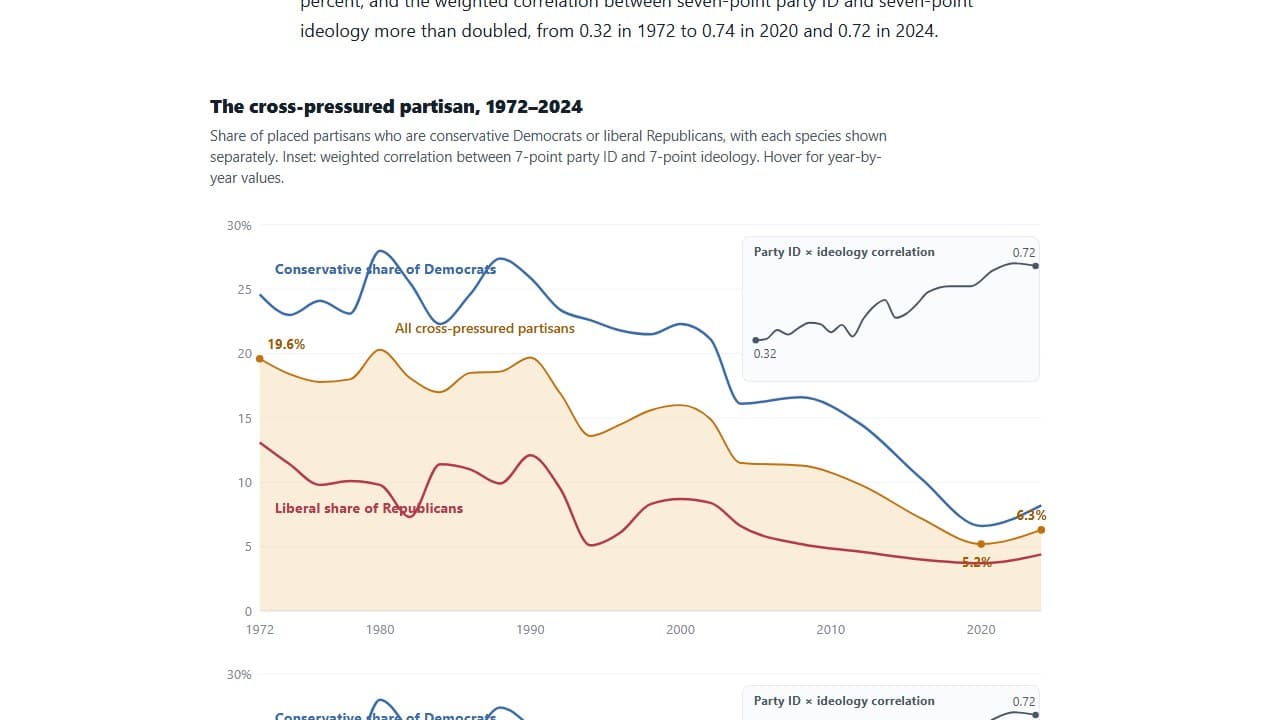
BlogAmerica Didn’t Wait for the Unsorted to Die — They Switched
Track ANES cross-pressured voters from 1972-2024 to test whether partisan sorting came from generational replacement or switching among existing cohorts.
 Blog
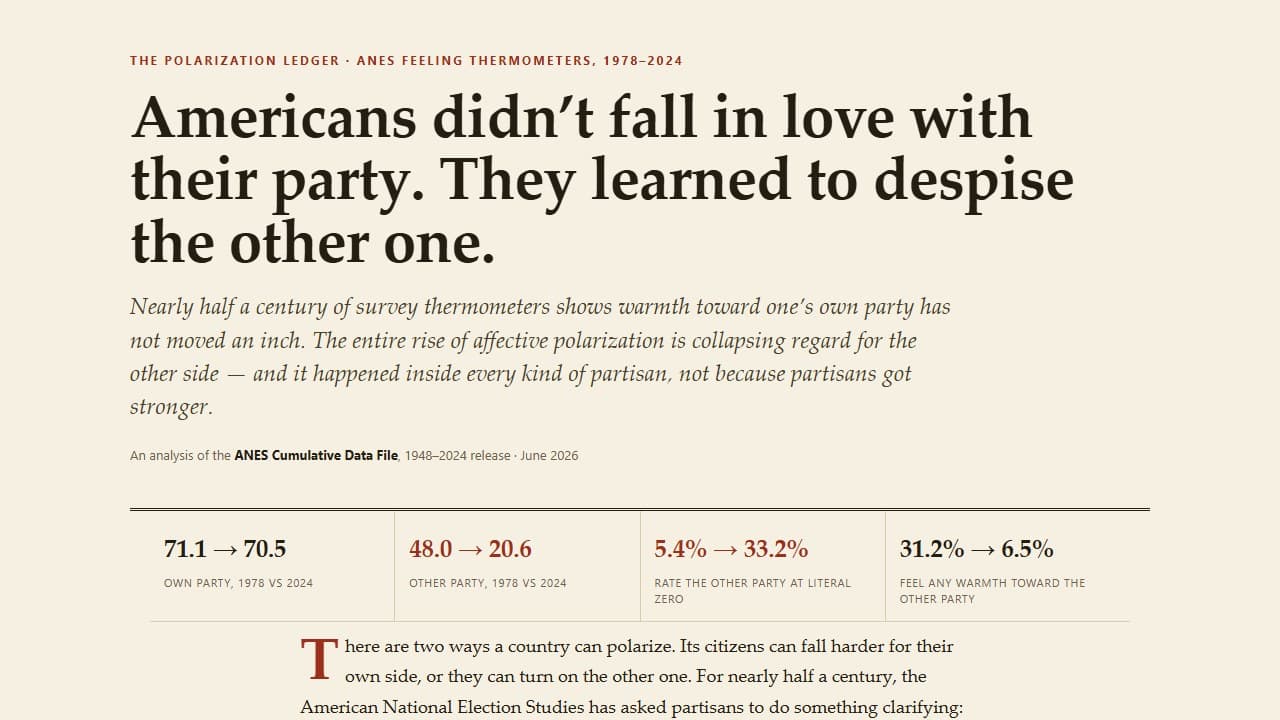
BlogAmericans Didn’t Fall in Love With Their Party. They Learned to Despise the Other One.
Use ANES feeling thermometers from 1978-2024 to separate in-party warmth from out-party dislike, distributional zeros, and affective polarization.
 Blog
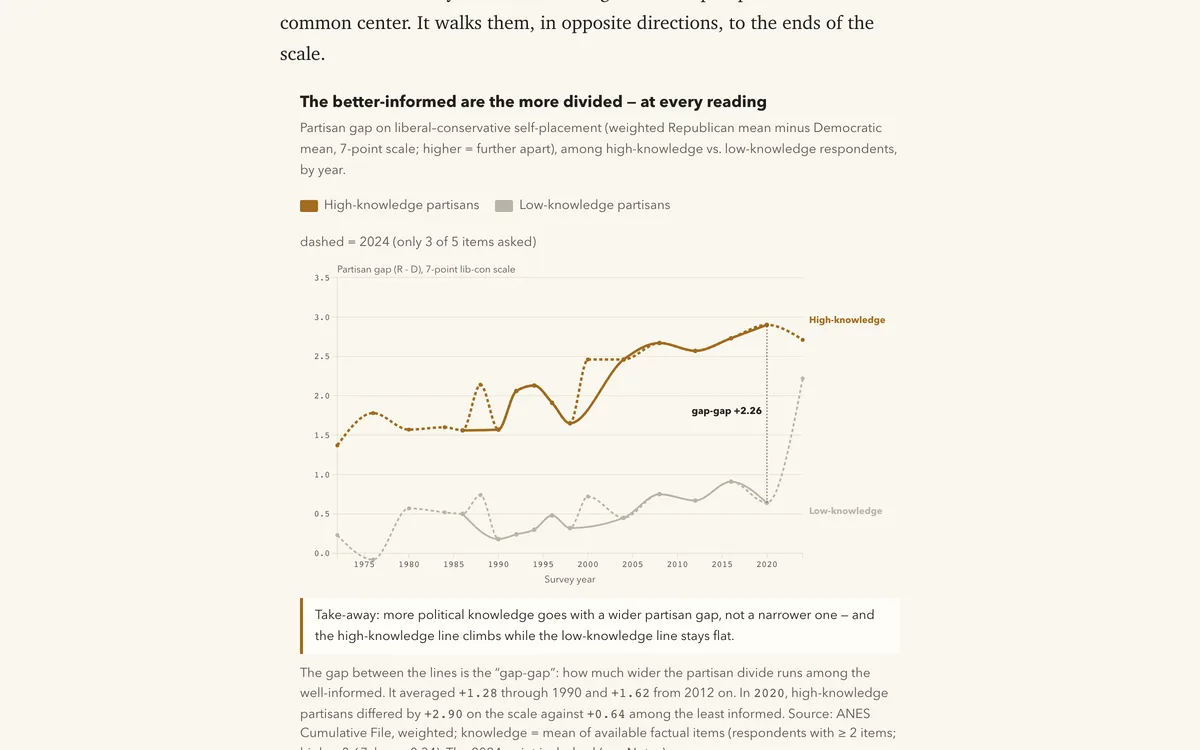
BlogInformation Doesn't Cool the Argument. It Sharpens It.
Across the ANES 1972-2024, the partisan gap on policy and racial attitudes is widest among the most politically knowledgeable Americans -- every year, and by a growing margin, even net of education. Information sorts; it does not depolar…
 Blog
BlogOne Country, Two Timelines
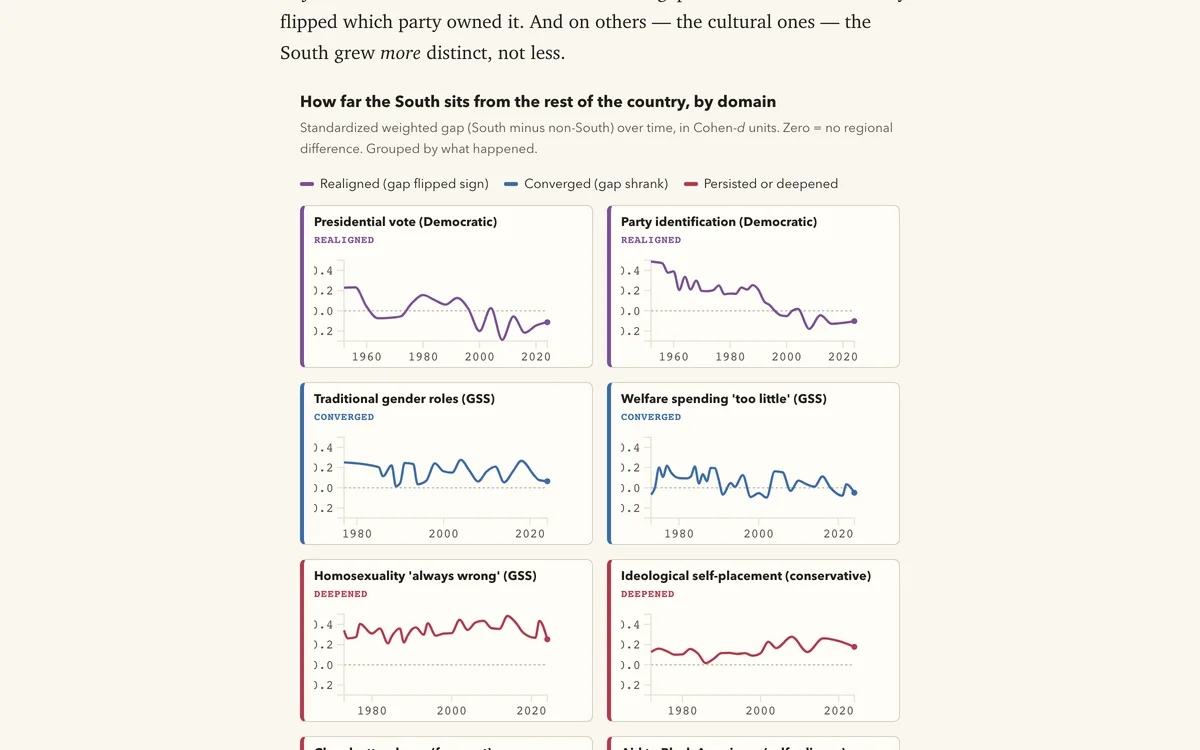
ANES, GSS, and county returns show the American South did three things at once: it realigned on party and the vote, converged on economics, and grew more distinct on religion and culture.
 Blog
BlogPartisans Finally Got Constraint
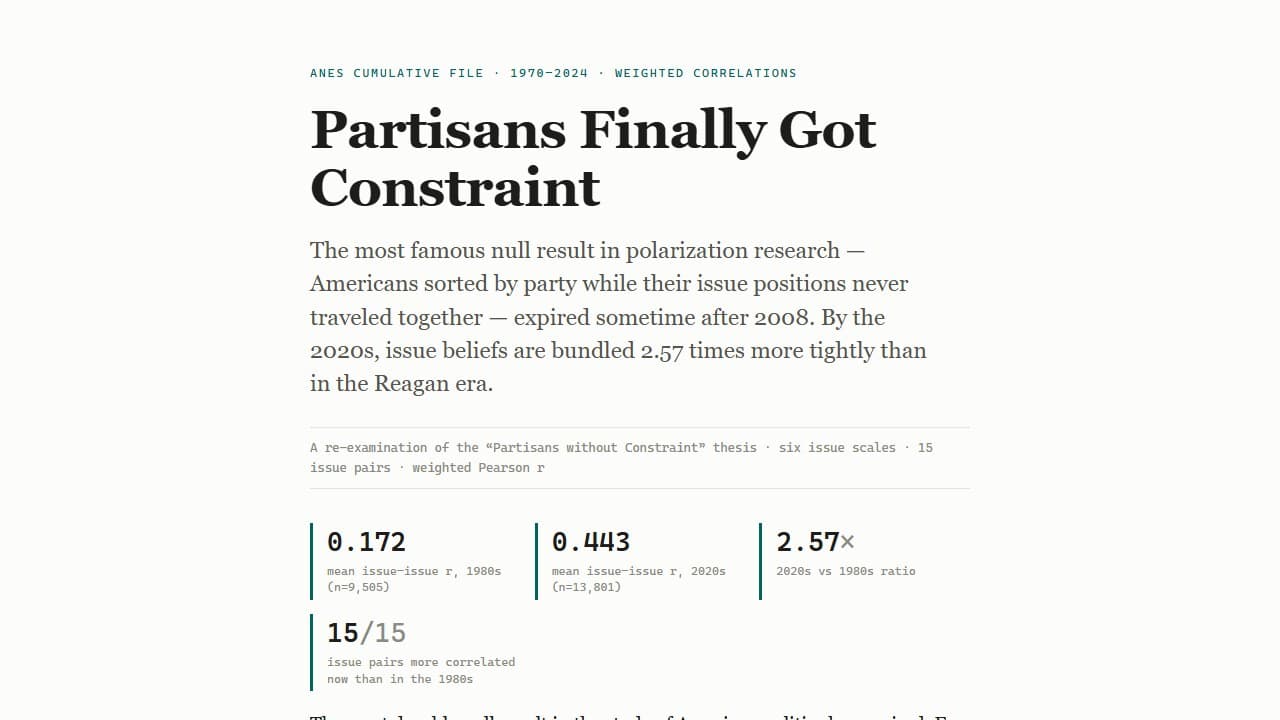
Revisit the partisans-without-constraint thesis with ANES issue-scale correlations, party-identification alignment, heatmaps, and sorting decompositions from 1970-2024.
 Blog
BlogPartisanship Ate the Thermometers
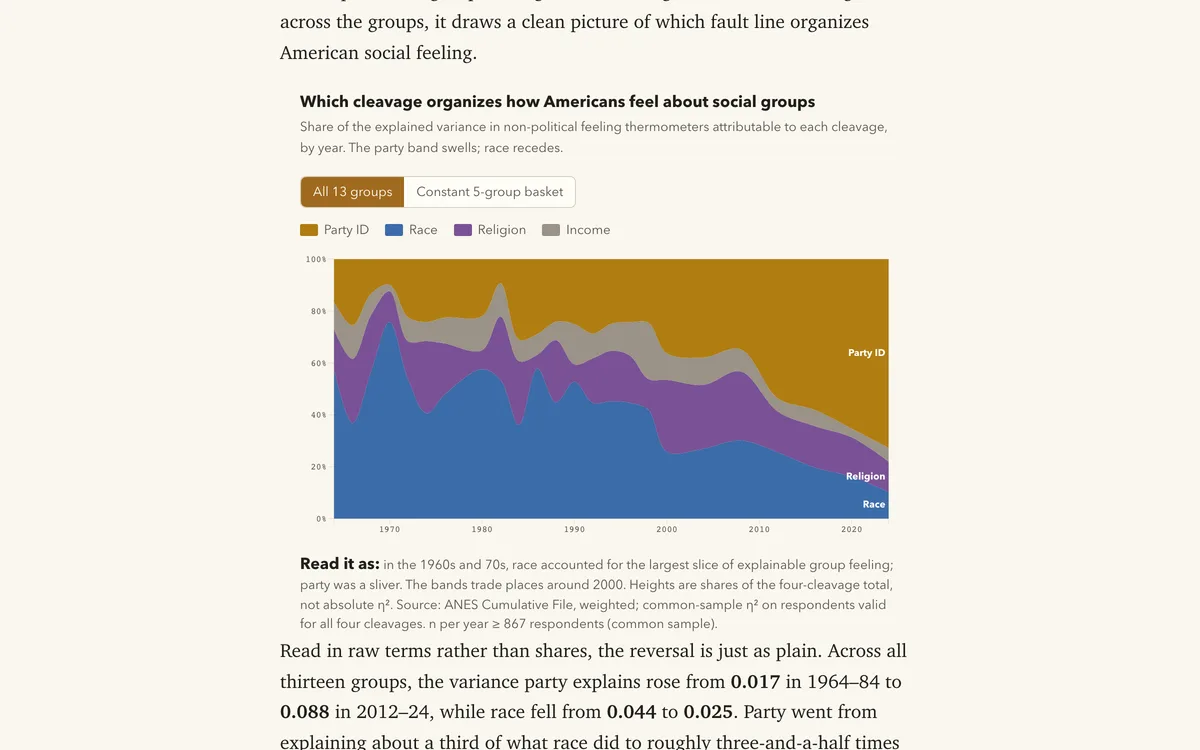
Across sixty years of ANES feeling thermometers, party ID has replaced race as the cleavage that best organizes how Americans feel about non-political social groups.
 Blog
BlogThe Abortion Sort
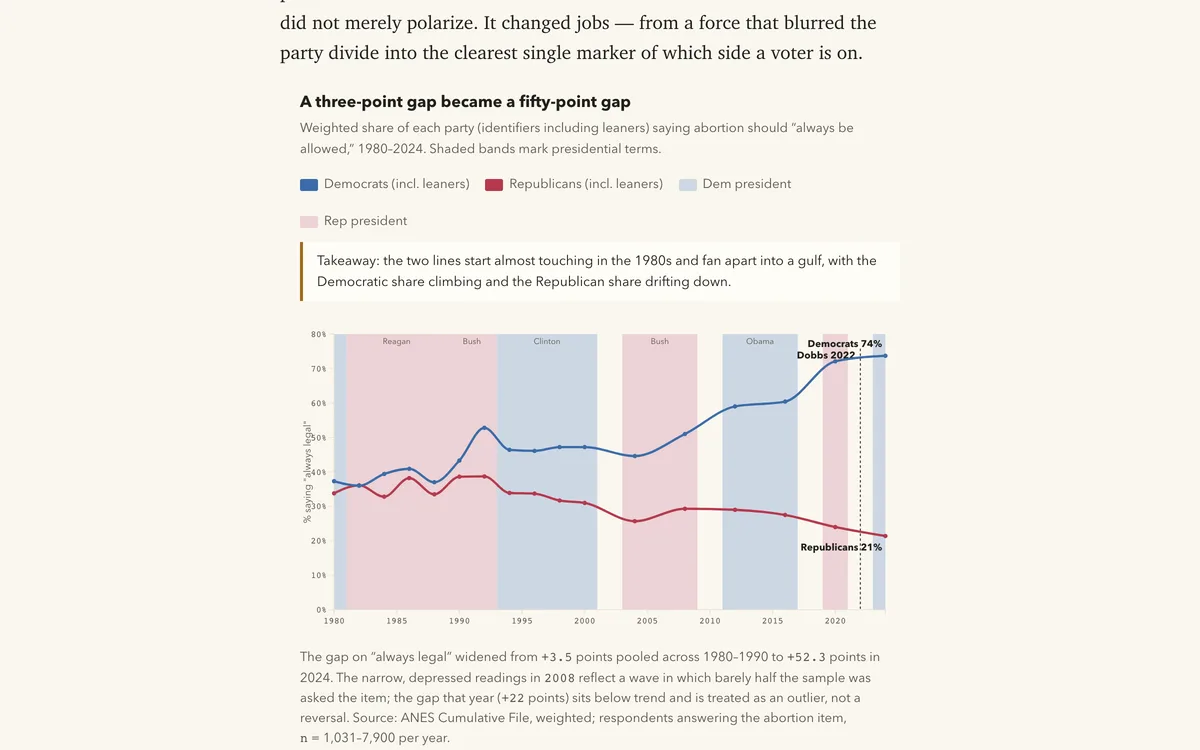
Across the ANES 1980-2024, abortion travelled from a cross-cutting issue on which the parties were statistically tied to the clearest single marker of party: the Dem-Rep gap on 'always legal' grew from about 3 points to 52, and the pro-l…
 Blog
BlogThe Diploma Divide Is a Culture Divide
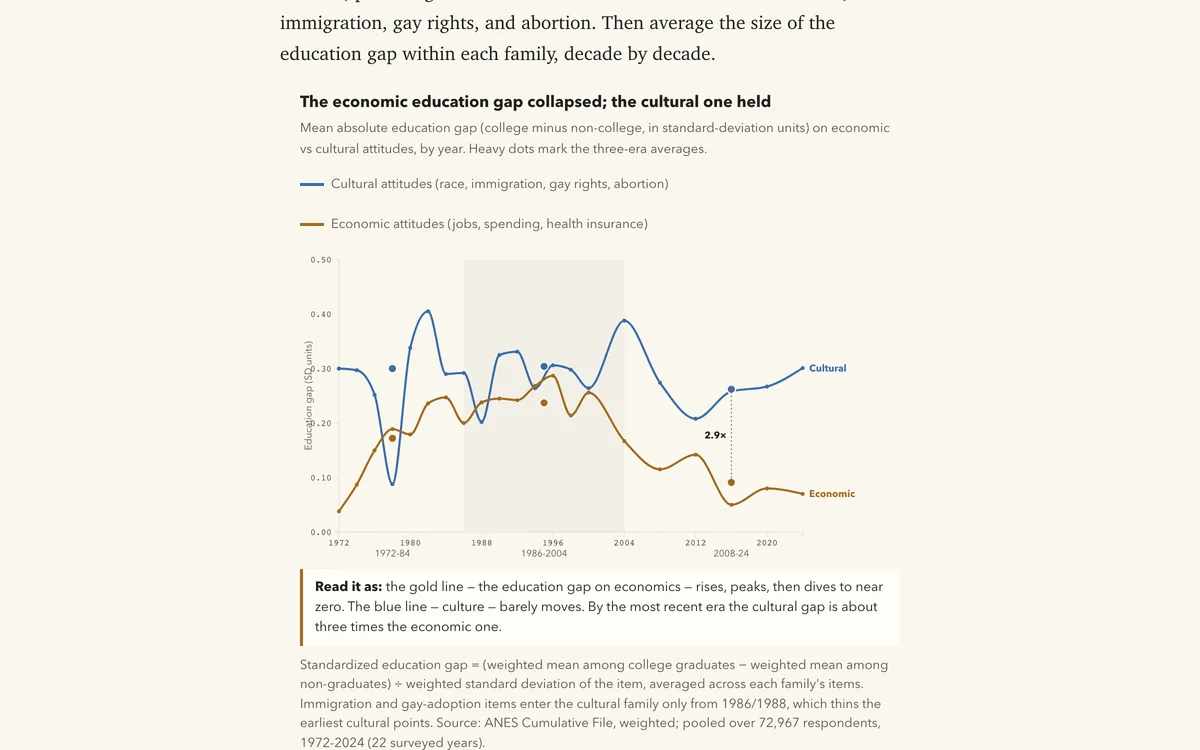
Across the ANES 1972-2024, the college education gap on economic redistribution attitudes has collapsed to near zero while the gap on cultural attitudes held -- by 2008-24 the cultural education gap is about three times the economic one.…
 Blog
BlogThe Economy Is a Partisan Mirror
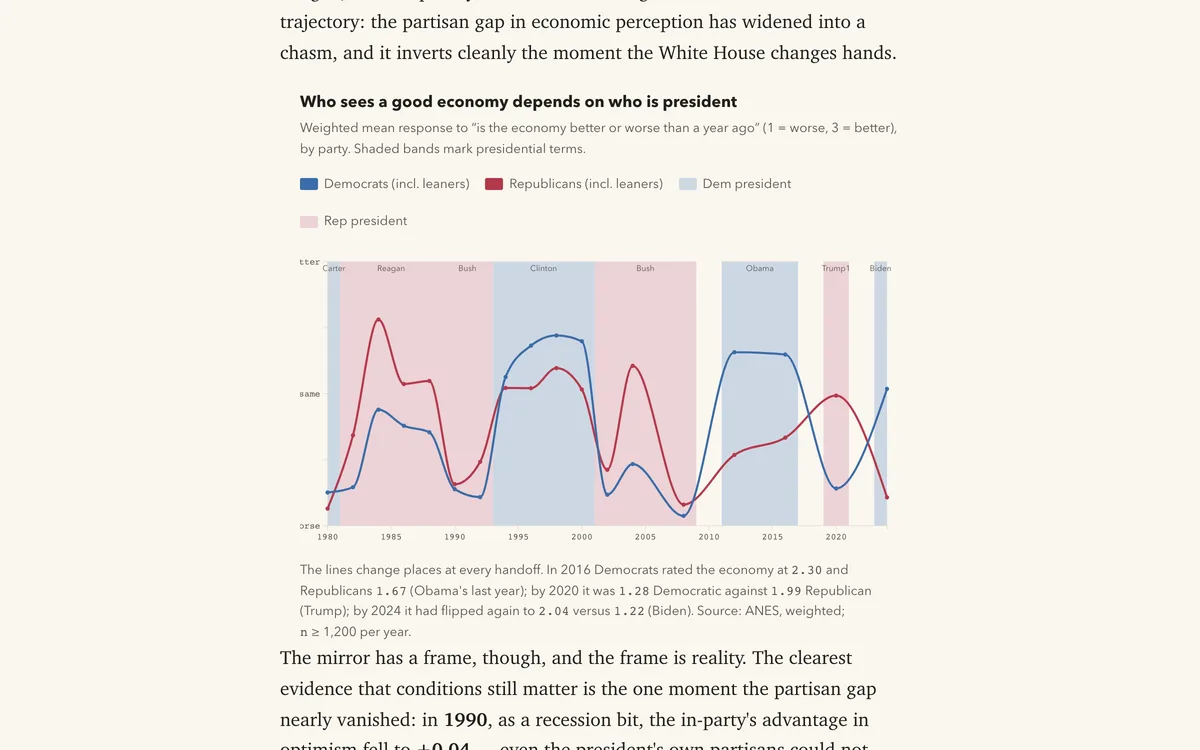
Across the ANES 1980-2024, Americans' judgment of the national economy depends overwhelmingly on whether their party holds the presidency; the partisan gap has doubled and inverts at every inauguration.
 Blog
BlogThe Gen Z Gender War Is Real, New — and Half the Size You’ve Heard
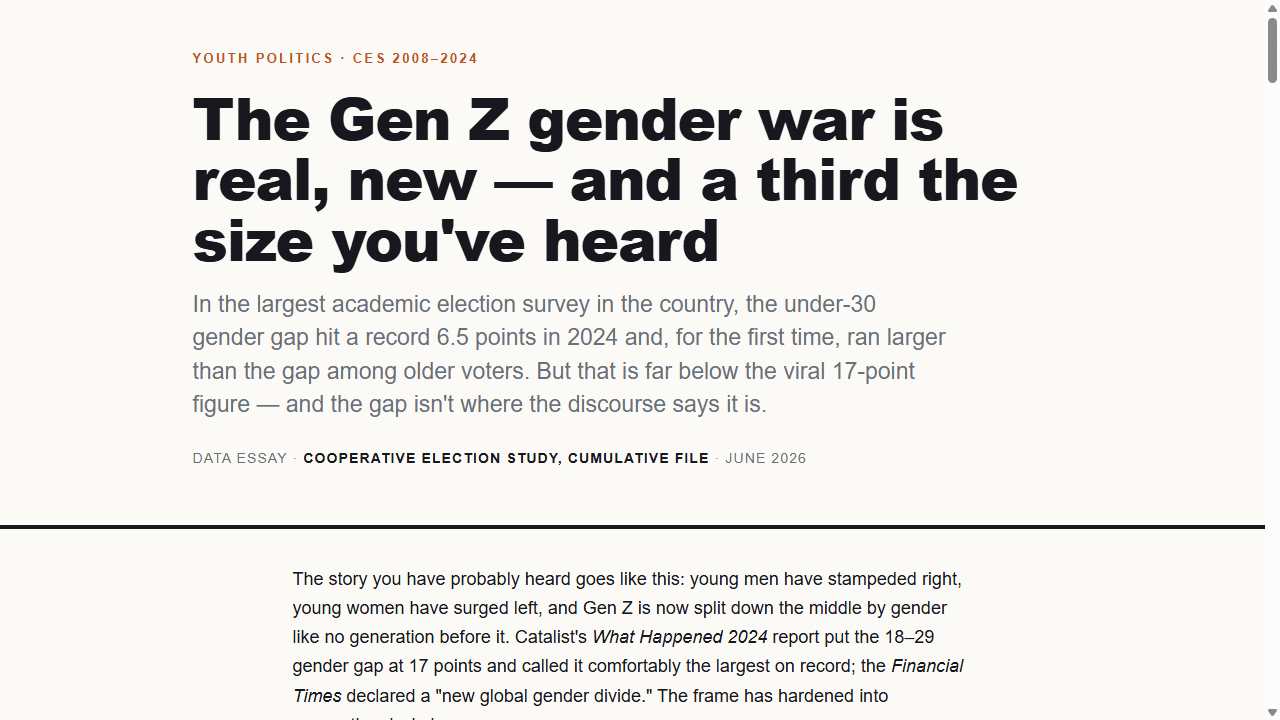
Use CES 2008-2024 data to size the under-30 gender gap, compare it with older voters, and separate the headline from the racial composition underneath it.
 Blog
BlogThe Great Sorting: How Americans Re-Sorted Into Two Parties
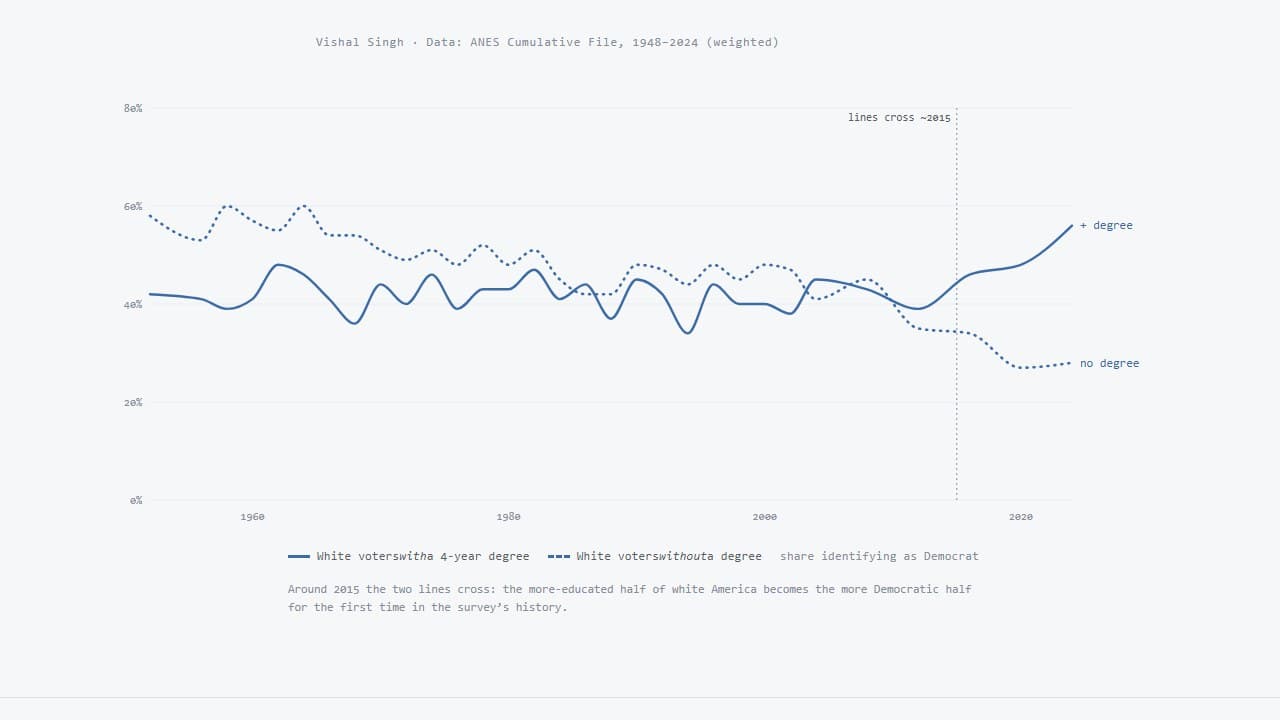
Follow ANES party-identification data from 1952-2024 to see how education, race, class, and religion reshaped the Democratic and Republican coalitions.
 Blog
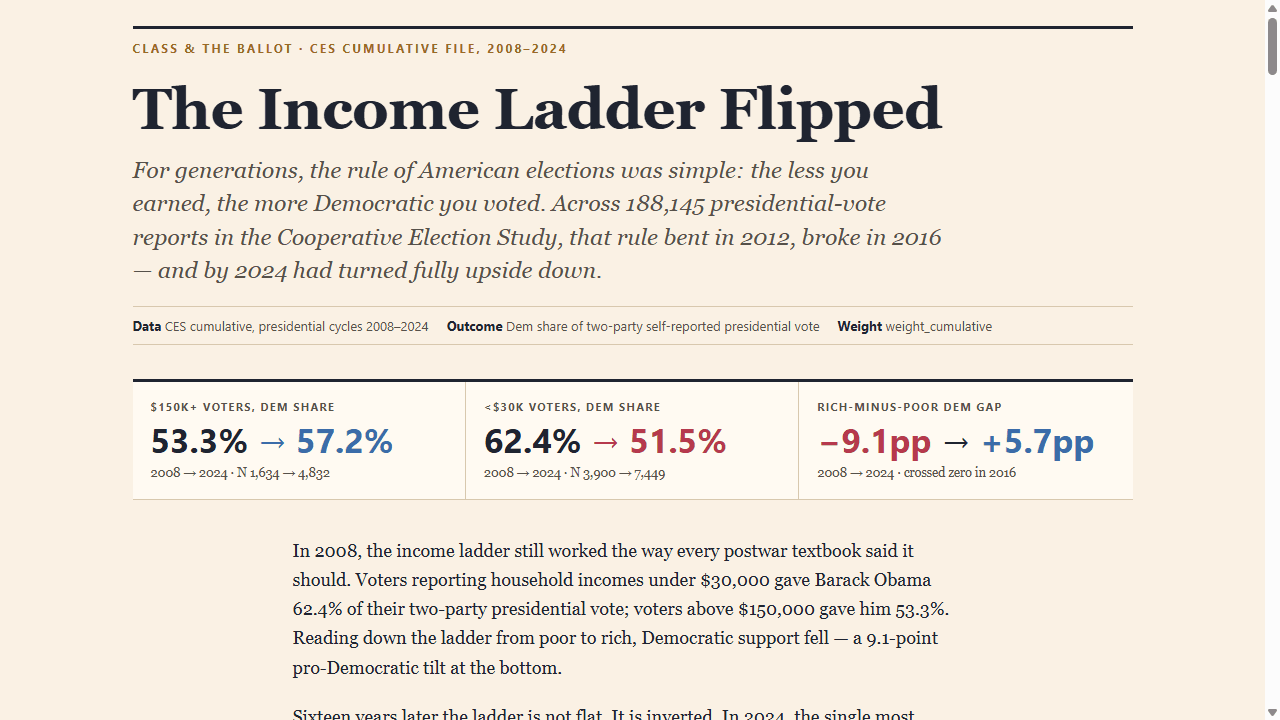
BlogThe Income Ladder Flipped
Trace CES presidential-vote reports from 2008-2024 to see how the classic income gradient inverted and why the richest voters became the most Democratic income group.
 Blog
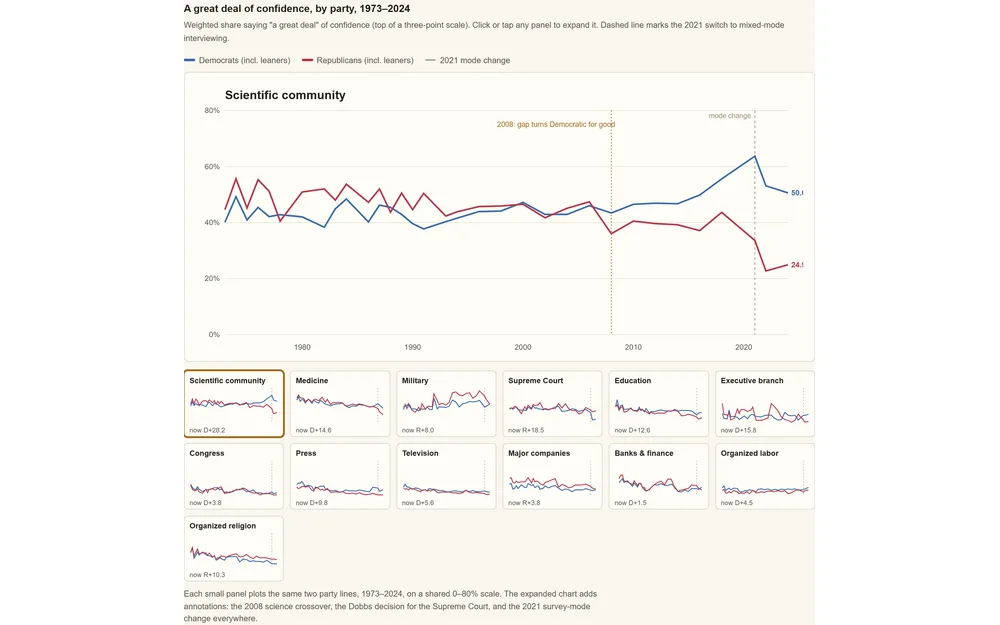
BlogThe Party of Science Switched Sides
Fifty years of General Social Survey data show Republicans went from the most science-confident party to the least — and the Supreme Court, the last consensus institution, finally broke too.
 Blog
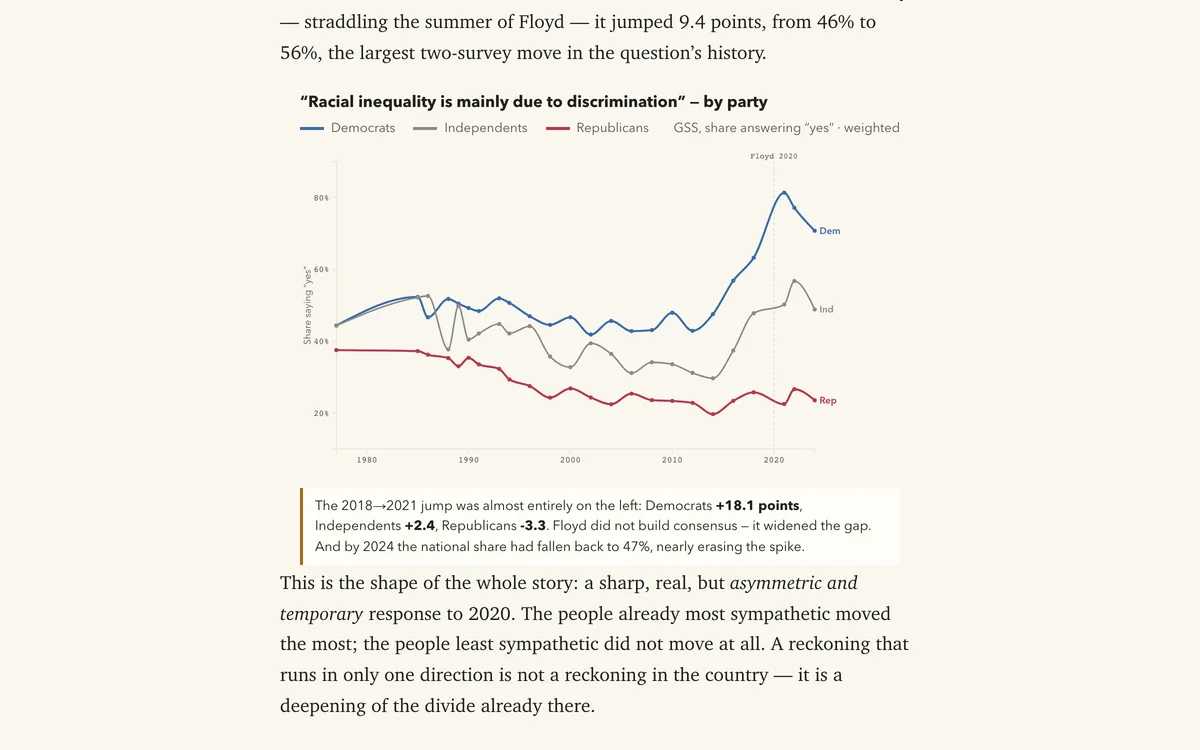
BlogTwo Shocks, One Mirror — Obama, Floyd, and American Racial Opinion
Did Obama's 2008 election and the 2020 George Floyd protests change American racial attitudes? Weighted GSS and ANES data show Floyd moved opinion sharply but only among Democrats, and only temporarily, while Obama's election warmed no o…
 Blog
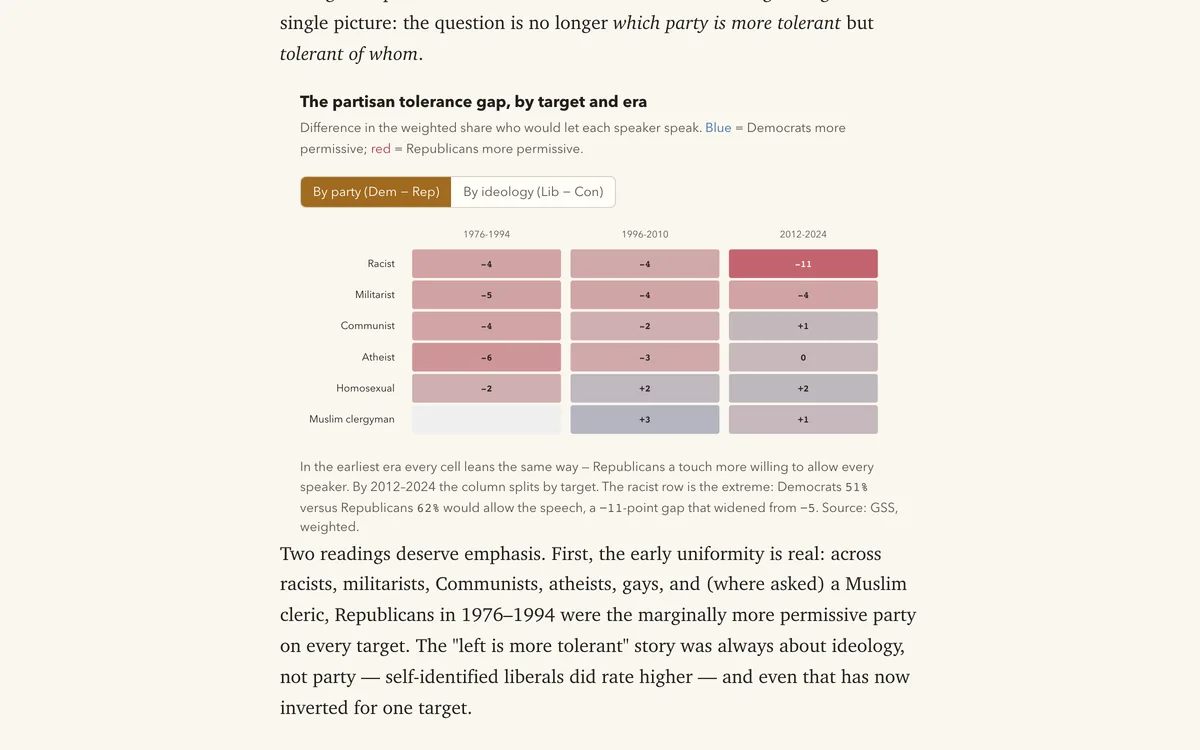
BlogWho Censors Whom
GSS tolerance data 1976-2024 show the partisan free-speech divide reorganized by target: the modern left will deny a platform to a racist while easing toward other speakers.
 Blog
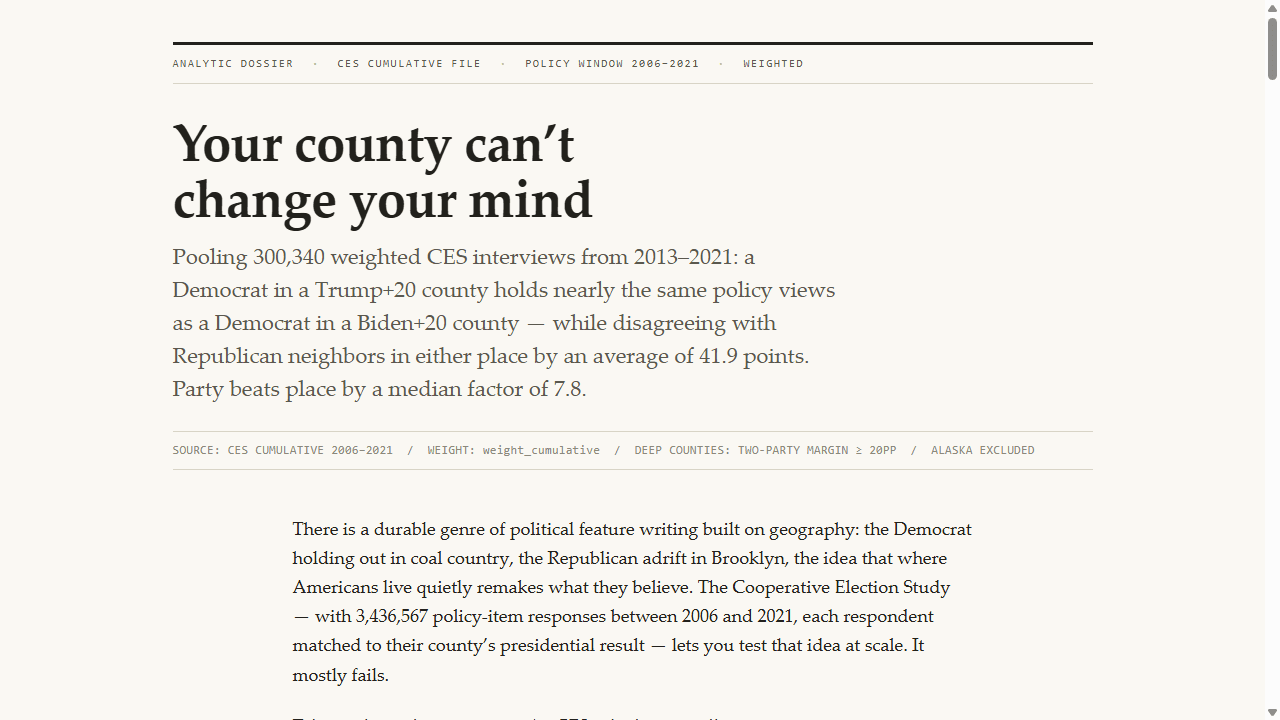
BlogYour County Can’t Change Your Mind: Party Beats Place 8-to-1
Pool CES interviews by county context to compare party identity with local red-blue environment across policy issues, showing how little place moves views once party is known.