Methods, AI & Data
The craft itself: visualization, causal inference, machine learning, and AI — methods explained with real data.
26 pieces
 BlogNew
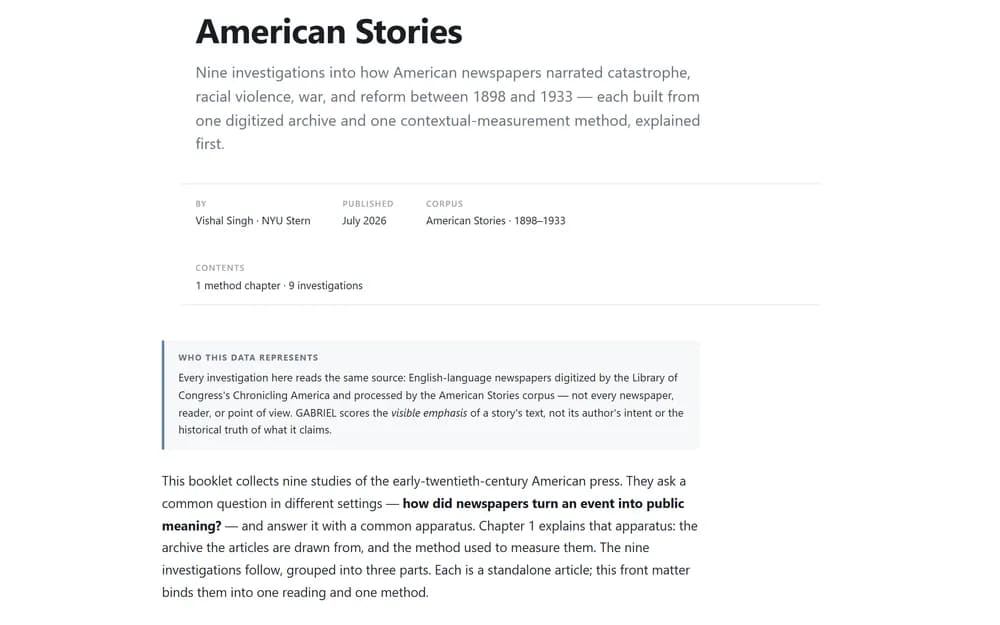
American Stories — A Booklet
A bound reading of nine American Stories investigations: how U.S. newspapers narrated catastrophe, violence, and reform between 1898 and 1933. Opens with the data and the GABRIEL method behind every article.
 Blog
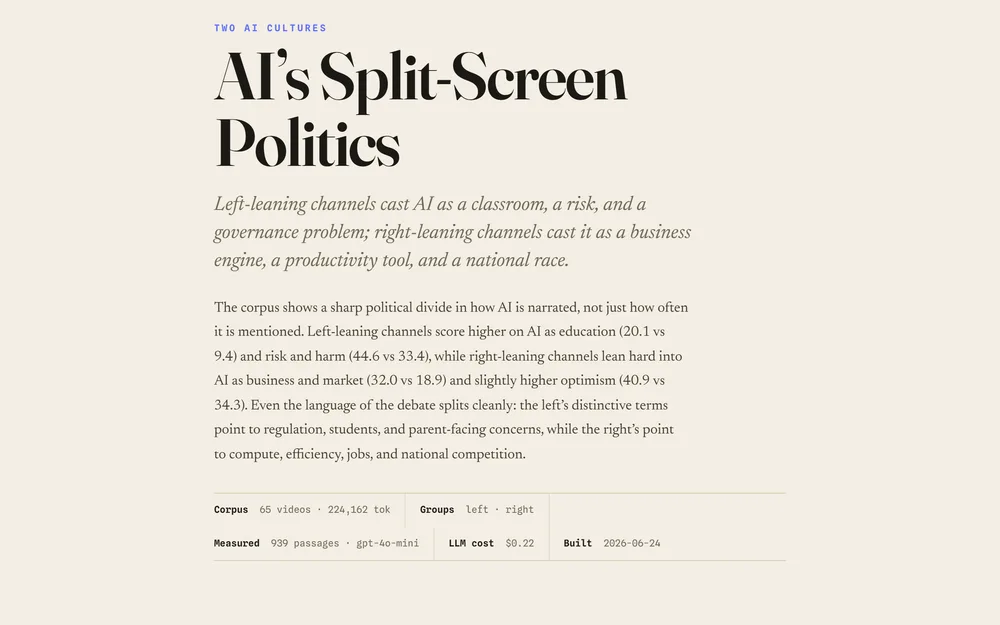
BlogAI’s Split-Screen Politics
Left-leaning channels cast AI as a classroom, a risk, and a governance problem; right-leaning channels cast it as a business engine, a productivity tool, and a national race.
 App
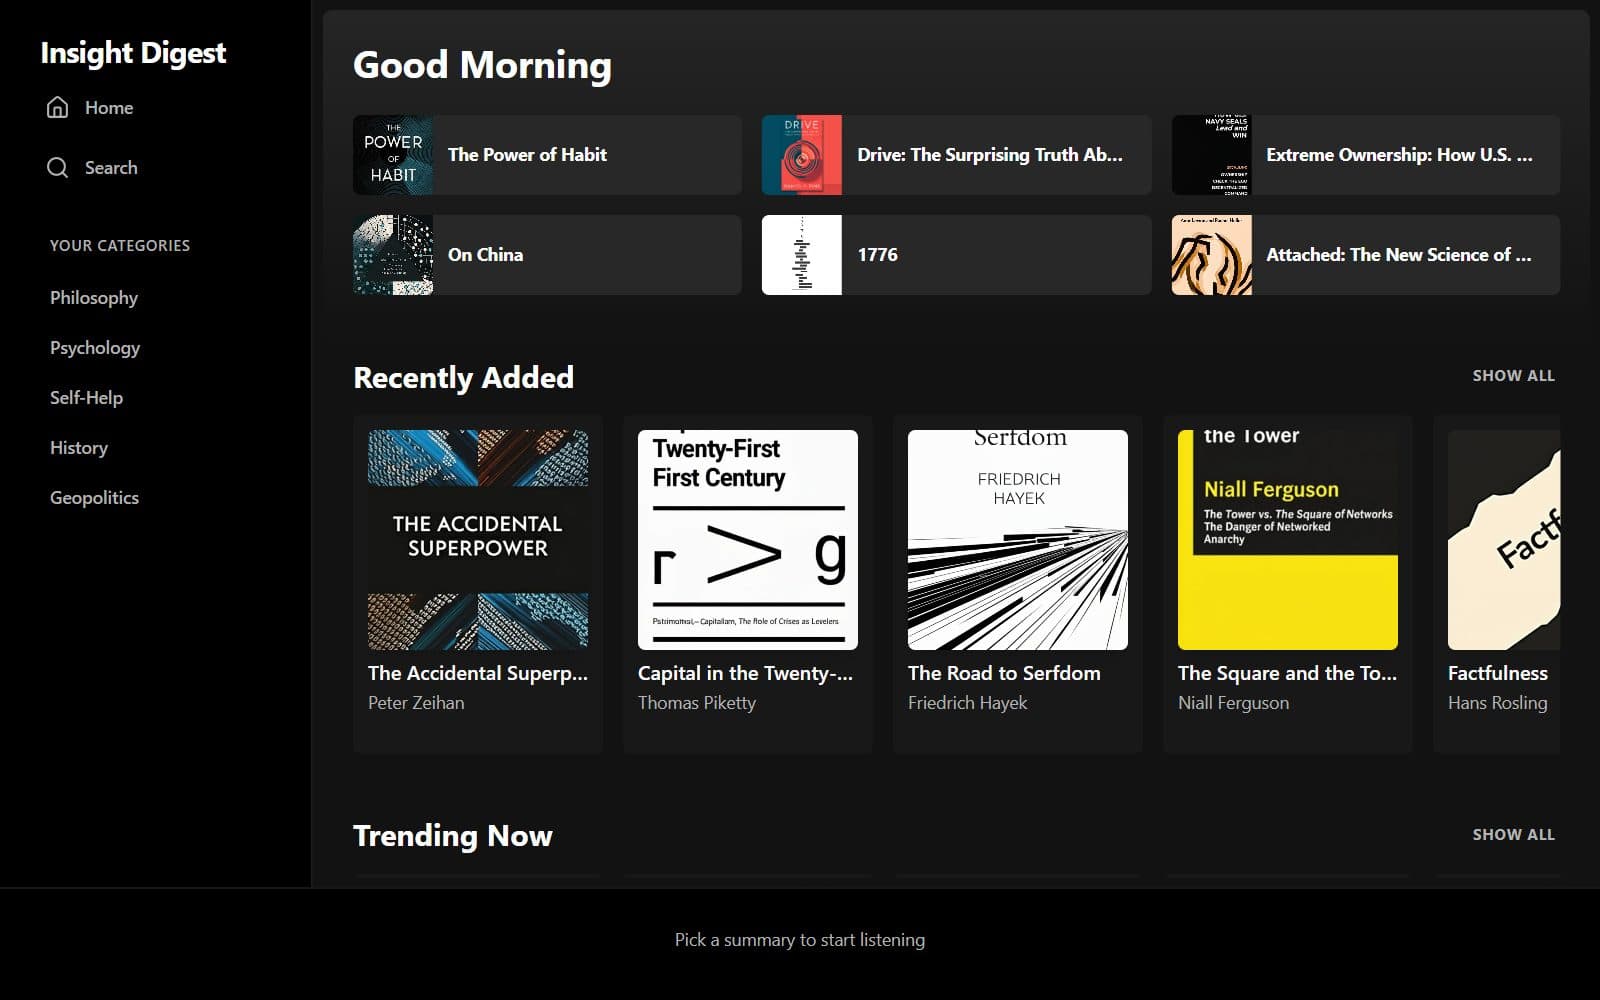
AppInsight Digest
AI-generated book summaries to read or listen to — across philosophy, psychology, self-help, history, and geopolitics.
 BlogNew
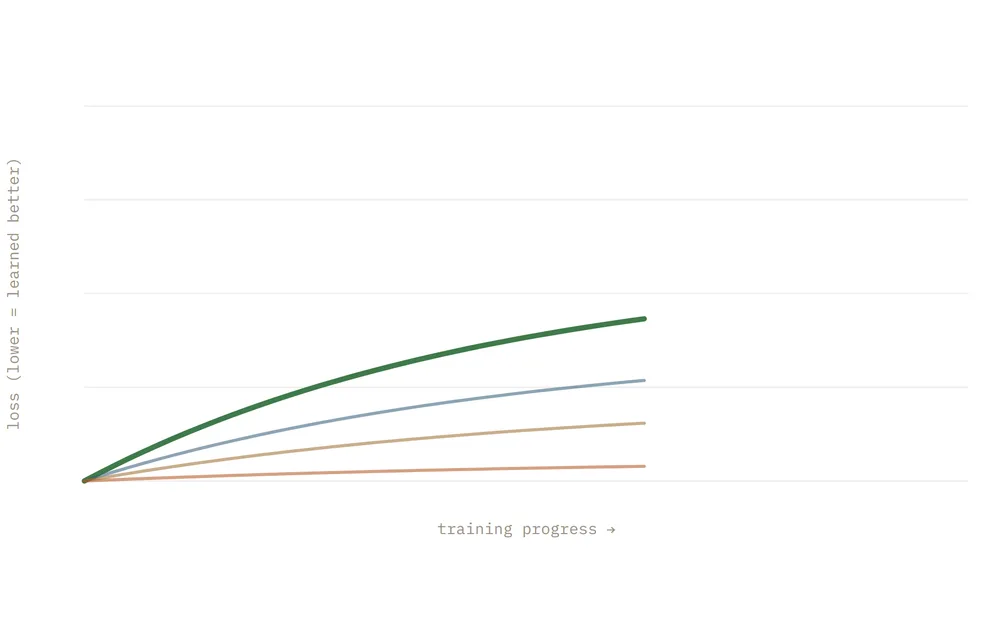
Beyond the Stochastic Parrot — Chomsky, LLMs, and the Nature of Meaning
An interactive essay on the stochastic-parrot debate: what Chomsky claims, how language models actually work, and what the evidence says about machine understanding.
 BlogNew
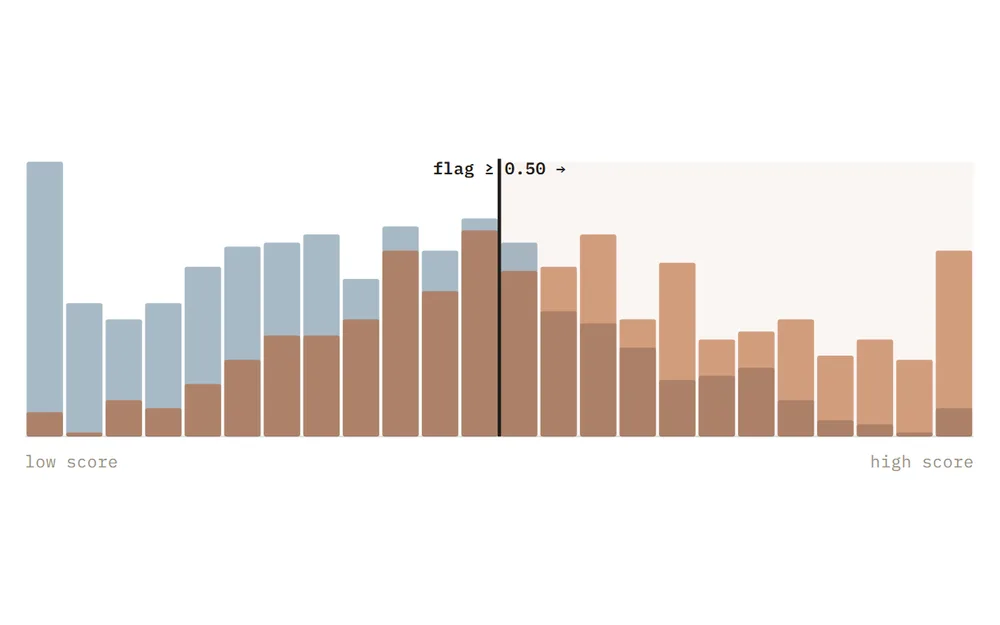
The Fairness You Can't Have — COMPAS, ProPublica, and the impossibility theorem
An interactive essay on algorithmic fairness: the COMPAS recidivism controversy, why calibration and equal error rates cannot both hold when base rates differ, and what the impossibility theorem means for anyone deploying a model.
The Measure of Words
A field booklet on text as data — six data essays, two live studios, and a data shelf, from dictionary word counts to LLM measurement at scale.
 BlogNew
Why the Data Won't Tell You Why — Causal inference for decision-makers
An interactive essay on causal inference: Simpson's paradox, causal diagrams, confounders and colliders, the difference between seeing and doing, and why every observational causal claim rests on assumptions the data cannot check.
 AppNew
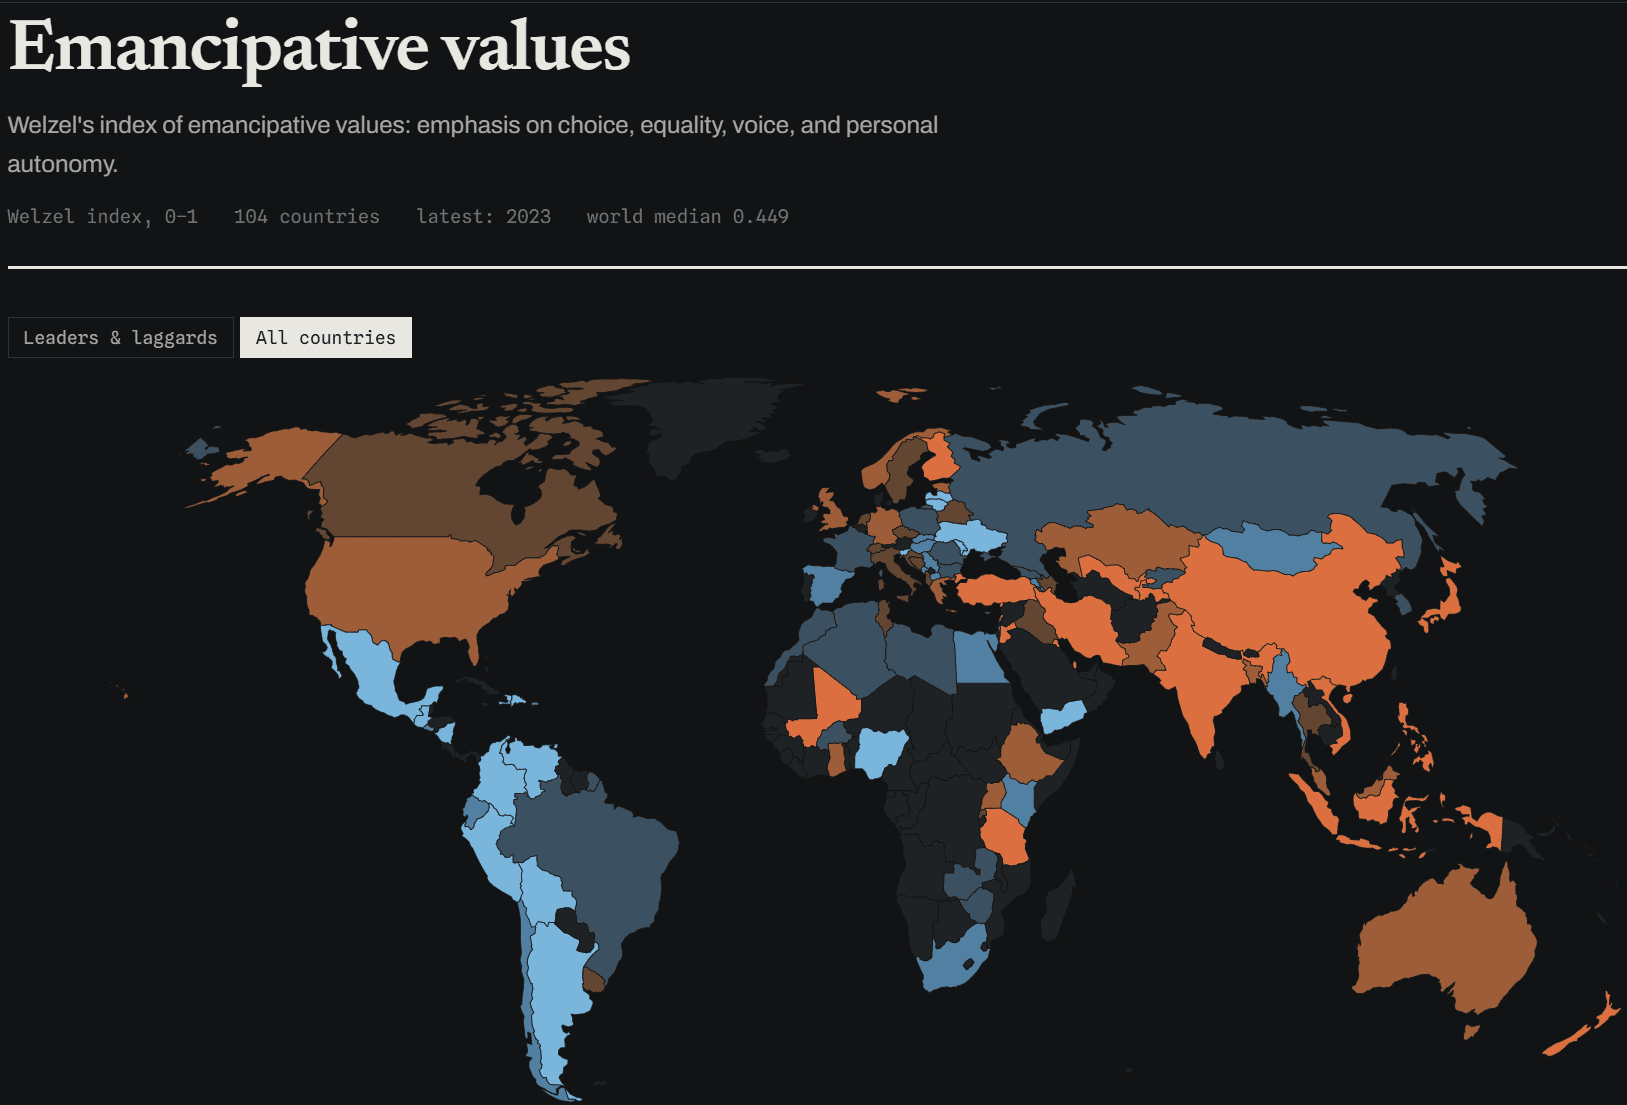
Worldlines — The World in Numbers
A cross-country indicators explorer — 85 measures of development, democracy, belief, and wellbeing across 217 countries (1750–2025), with country profiles, rankings, and peer benchmarking.
 TeachingNew
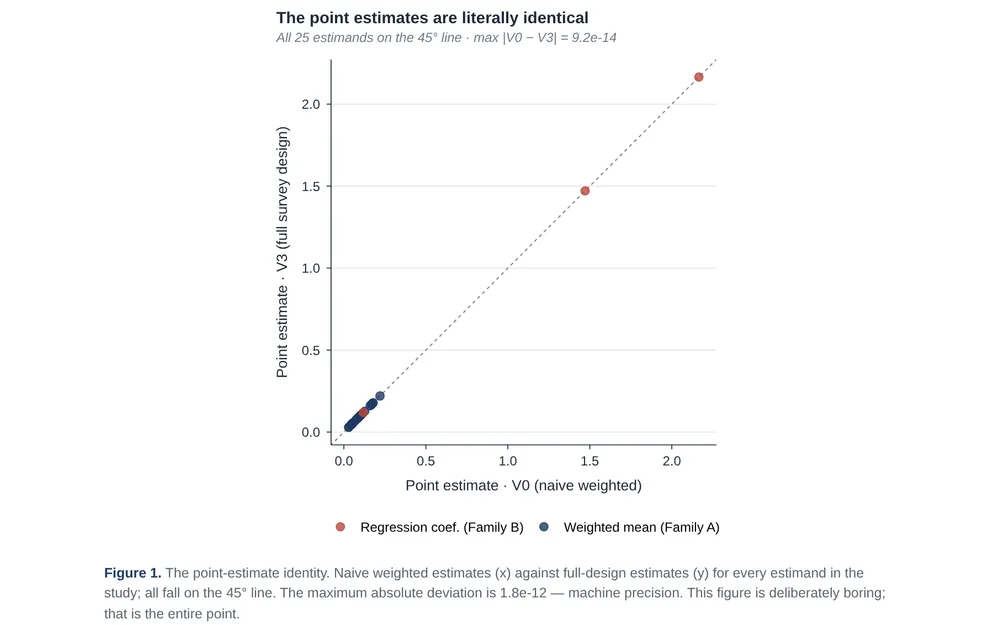
Same Betas, Three Standard Errors · NHANES
One NHANES dataset, four variance machines, and exactly what the naive standard error quietly gets wrong.
 BlogNew
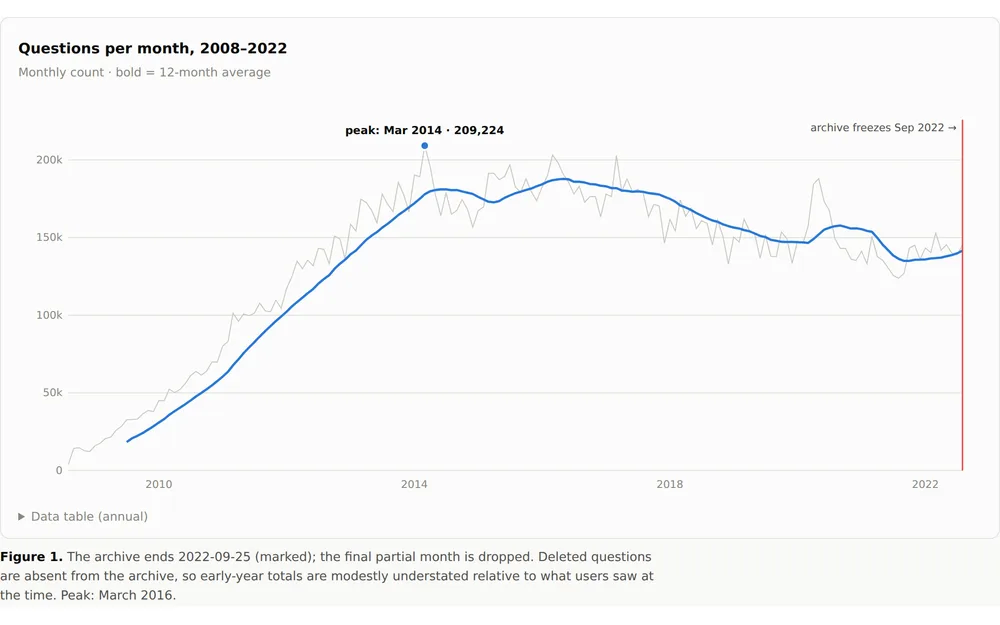
The Commons Was Already Dying
23 million Stack Overflow questions show the knowledge commons peaked in 2016 and hardened long before ChatGPT arrived to finish the job.
 BlogNew
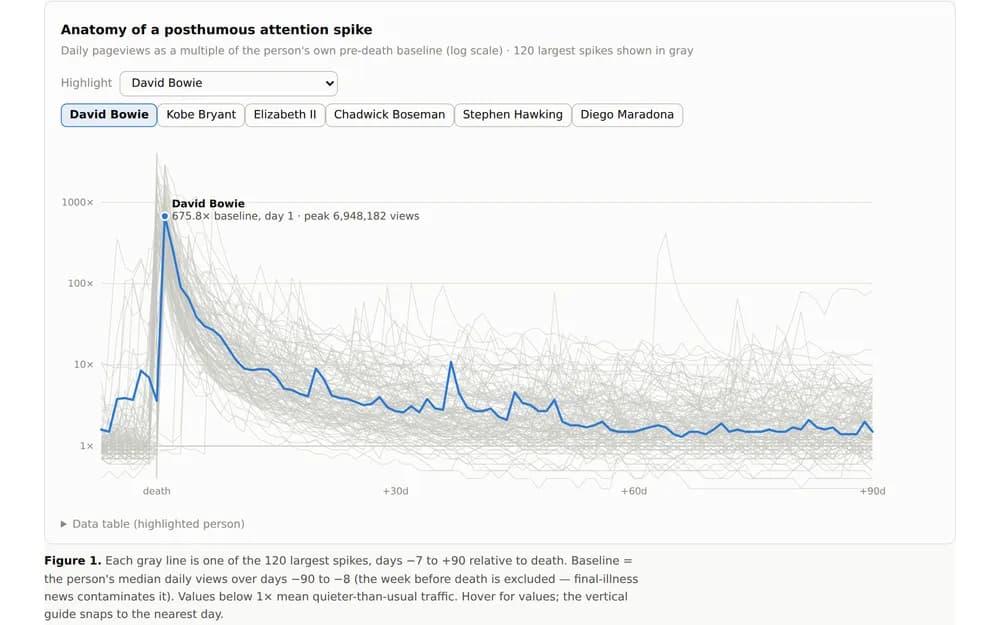
The Half-Life of Fame
What 719 celebrity deaths reveal about how attention works: the spike is enormous, the decay is brutal, and the half-life is one day.
 BlogNew
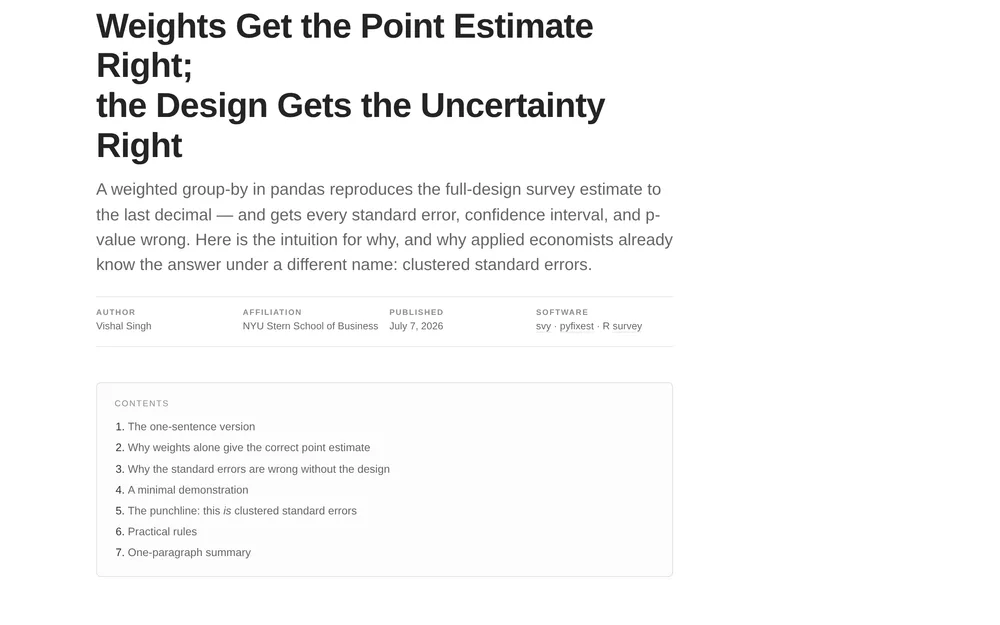
Weights Get the Point Estimate Right; the Design Gets the Uncertainty Right
Why survey-weighted means match full-design estimates exactly while their standard errors do not — and how this is the same problem clustered standard errors solve in econometrics.
 Teaching
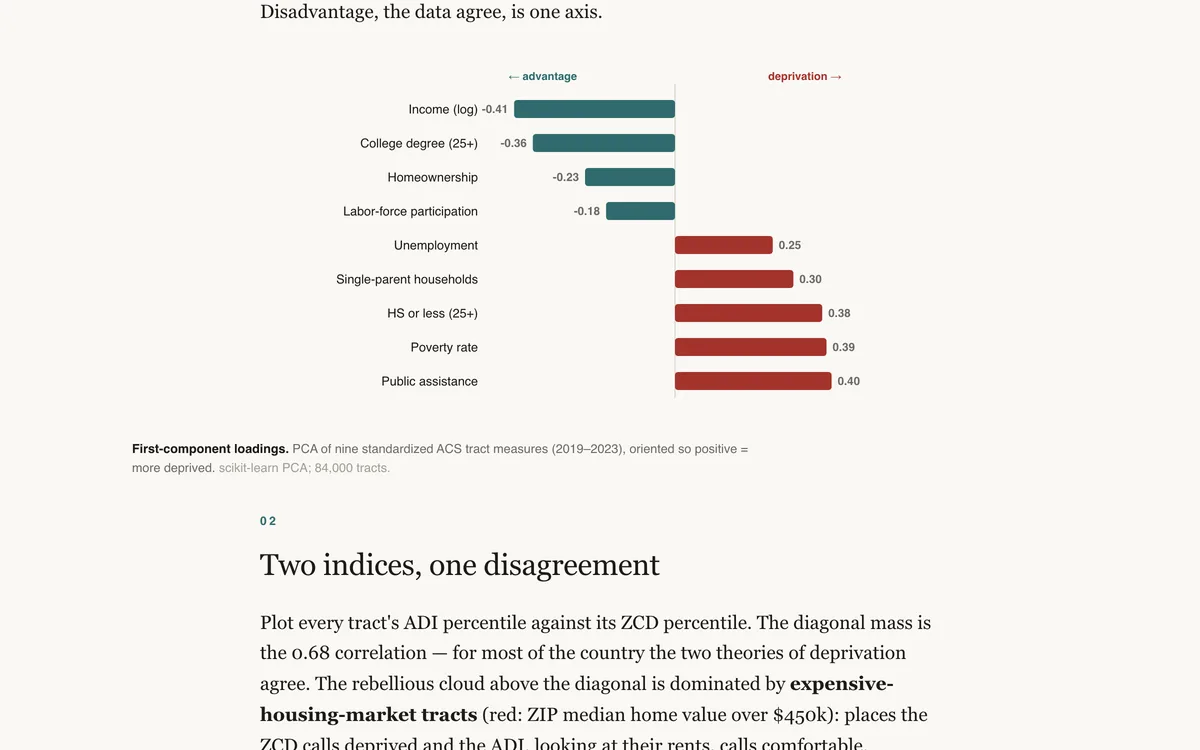
An Index Autopsy
We rebuilt a deprivation index from scratch with PCA — no housing costs — and compared it to the canonical ADI. They agree on the gradient and disagree violently about New York.
 App
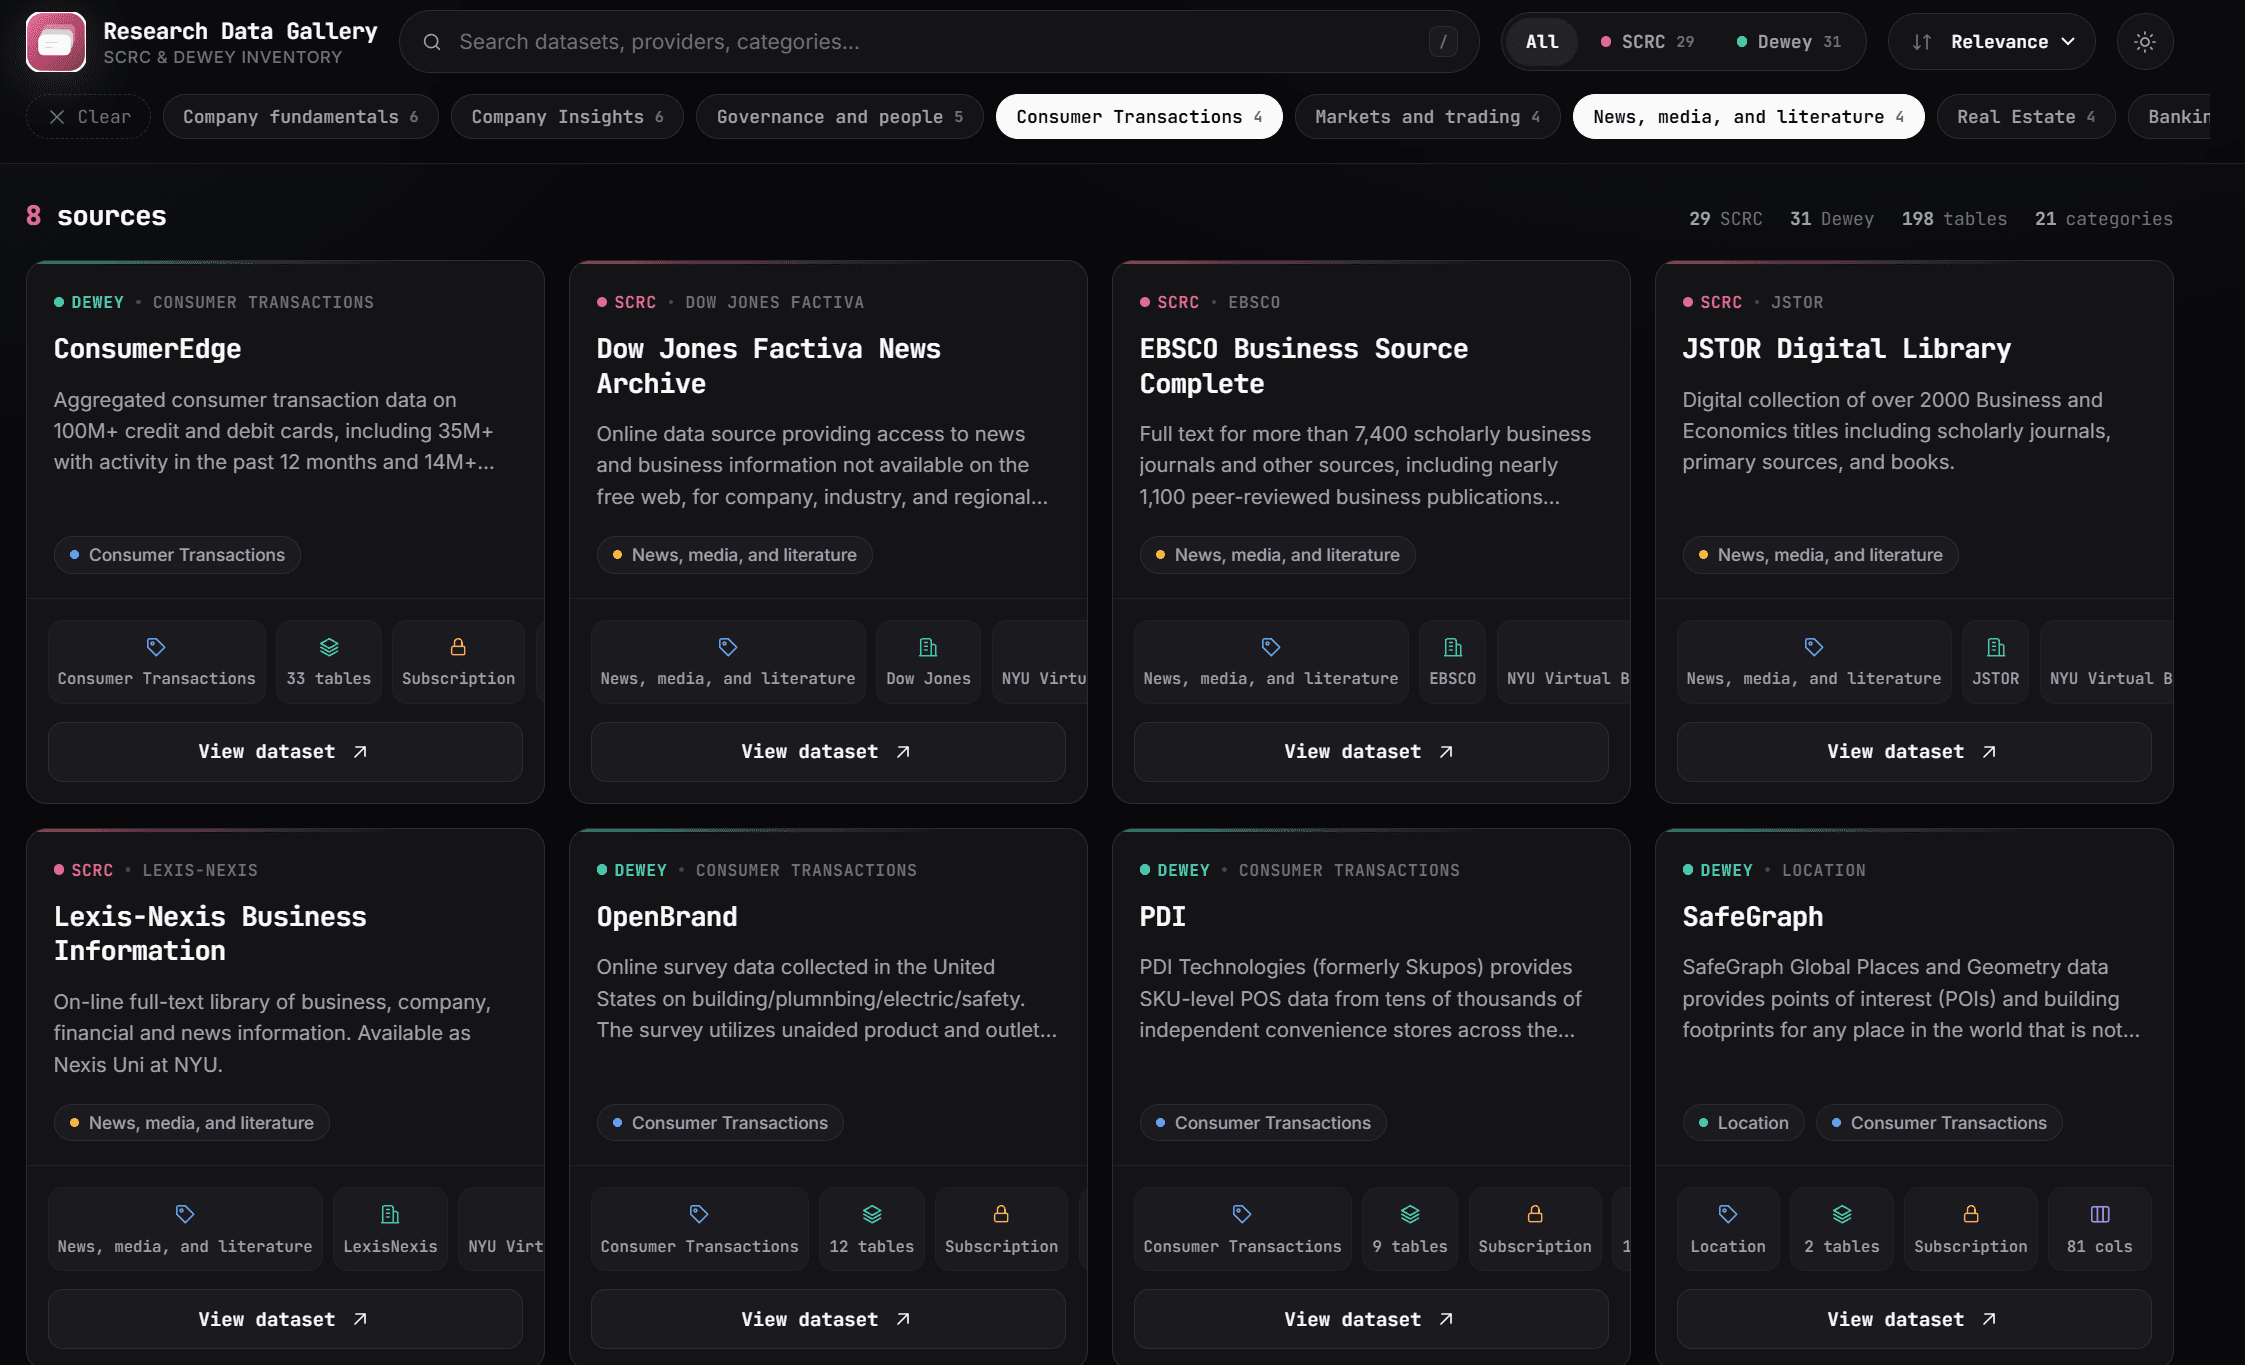
AppResearch Data Gallery — SCRC & Dewey
A research-data gallery surfacing curated datasets for teaching and analysis.
Political books review corpus
Amazon-style political and business book reviews with ratings, text, review metadata, product description, category, price, and reviewer fields.
 Teaching
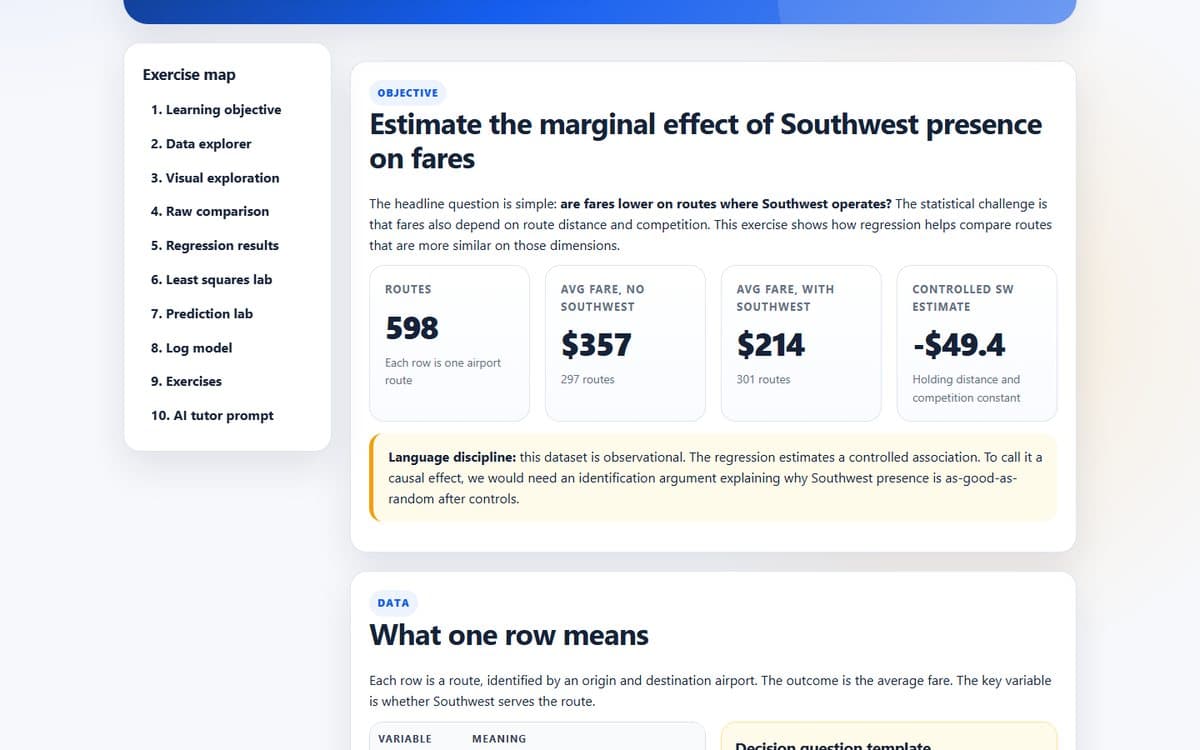
Regression Exercise: Did Southwest Lower Airfares?
The hands-on companion: download the route data, run the regression yourself, and read the coefficients the way a manager would. Built for a live class session.
 App
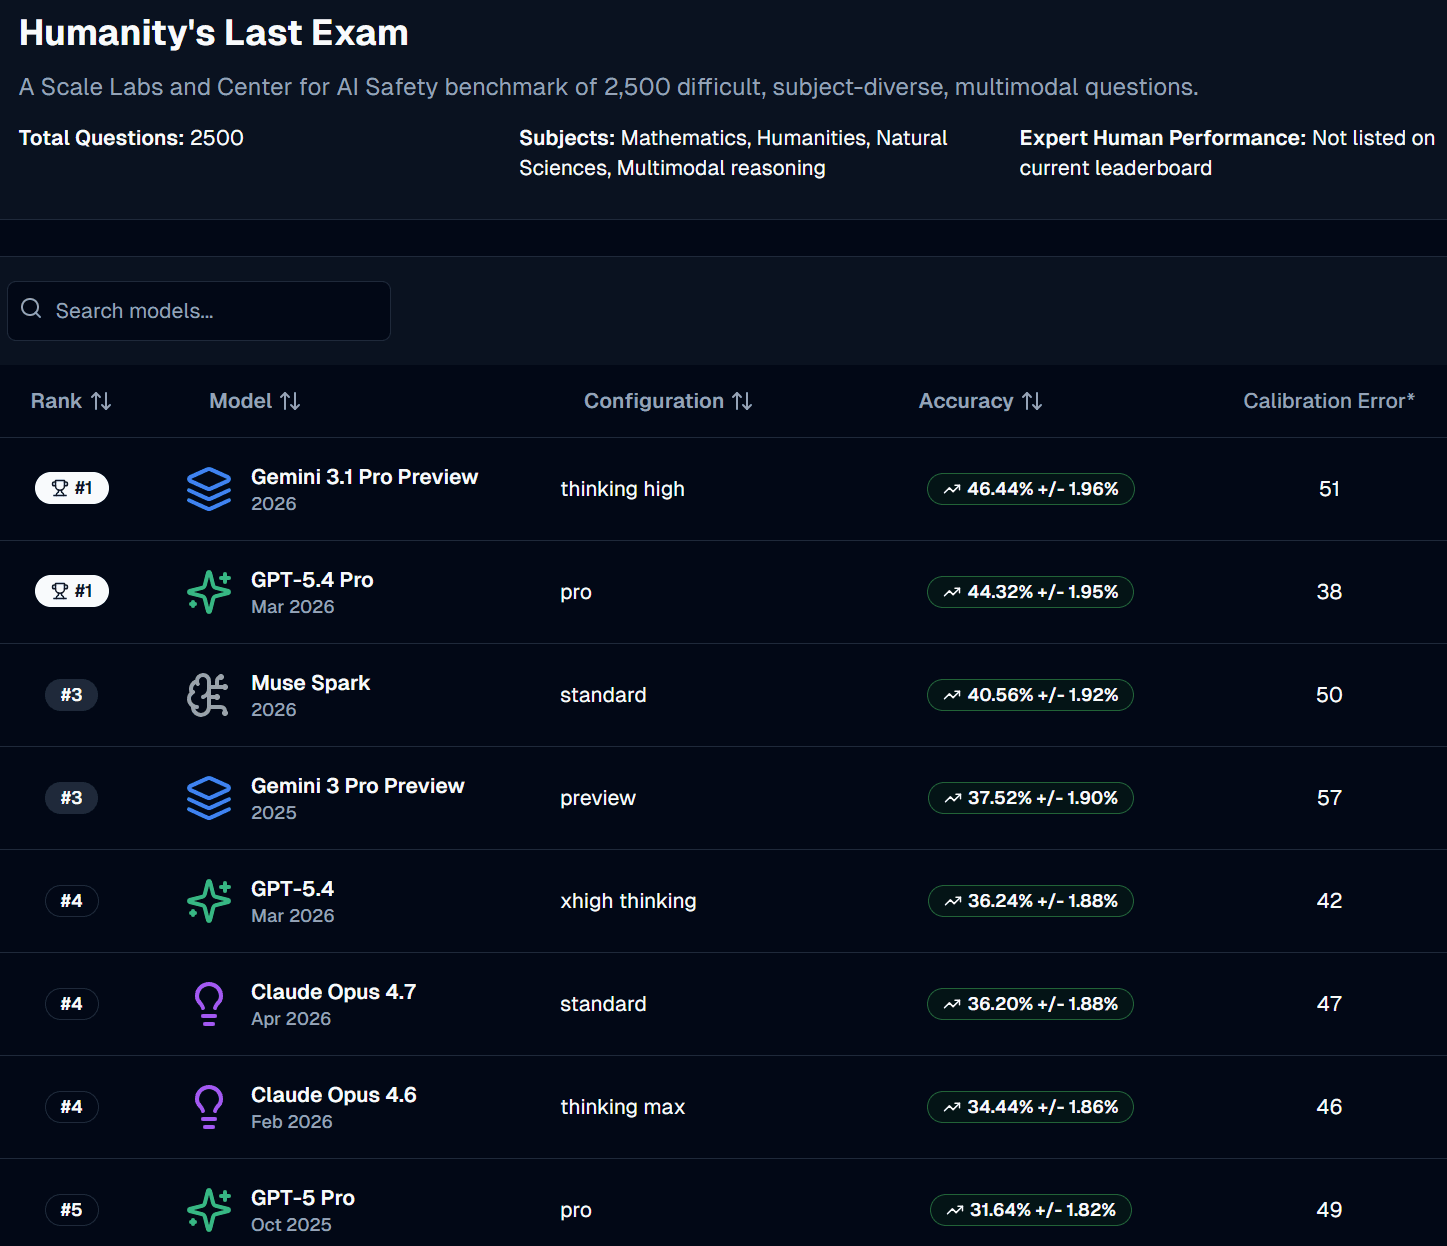
AppAI Models & Benchmarks
A filterable, sortable comparison of frontier and open-weight models — context windows, pricing, modalities, and access.
 Teaching
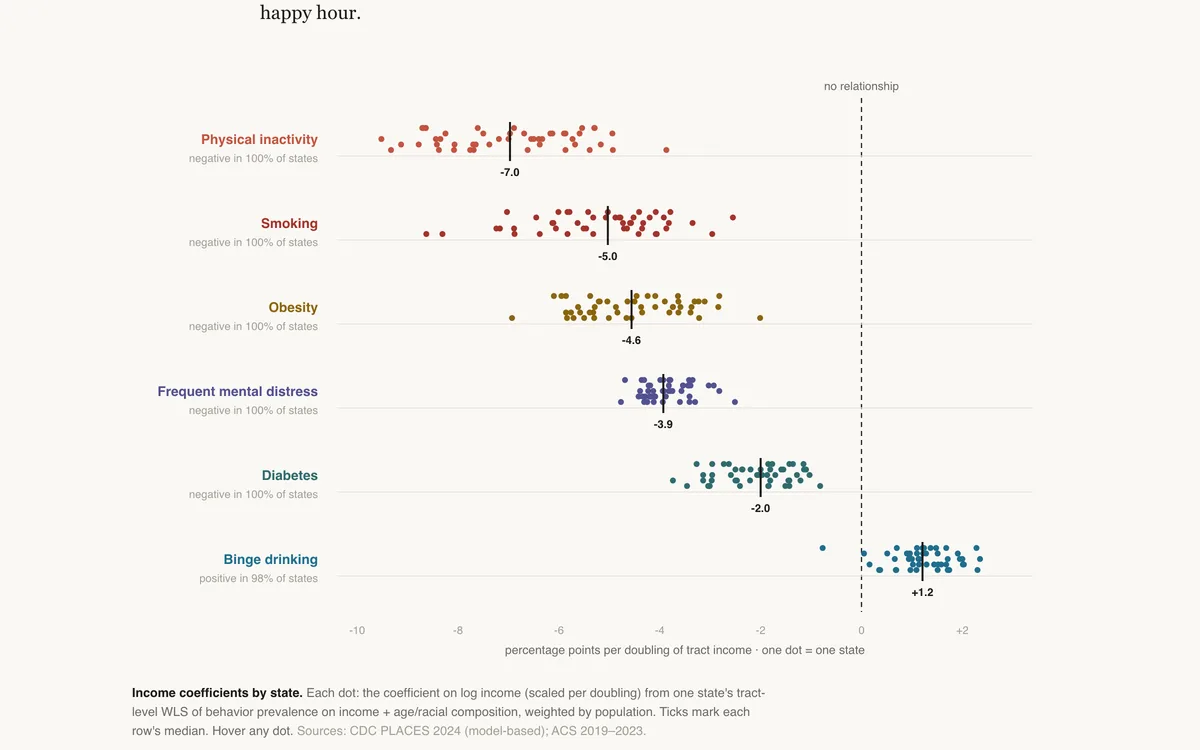
The Coefficient Zoo
Fifty-one regressions per health behavior: what doubling a neighborhood's income does to smoking, obesity, and — running the other way in 98% of states — binge drinking.
 Teaching
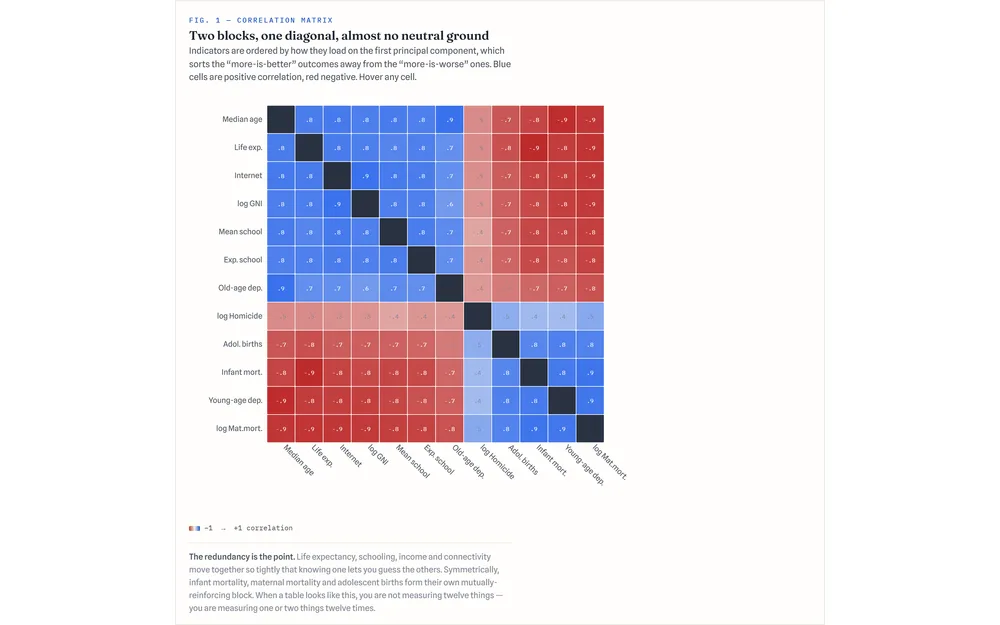
The Shape of Development — PCA, Factor Analysis & Clustering
Twelve numbers describe a country. It turns out you need barely one. A working note on principal components, factors, and clusters.
 Teaching
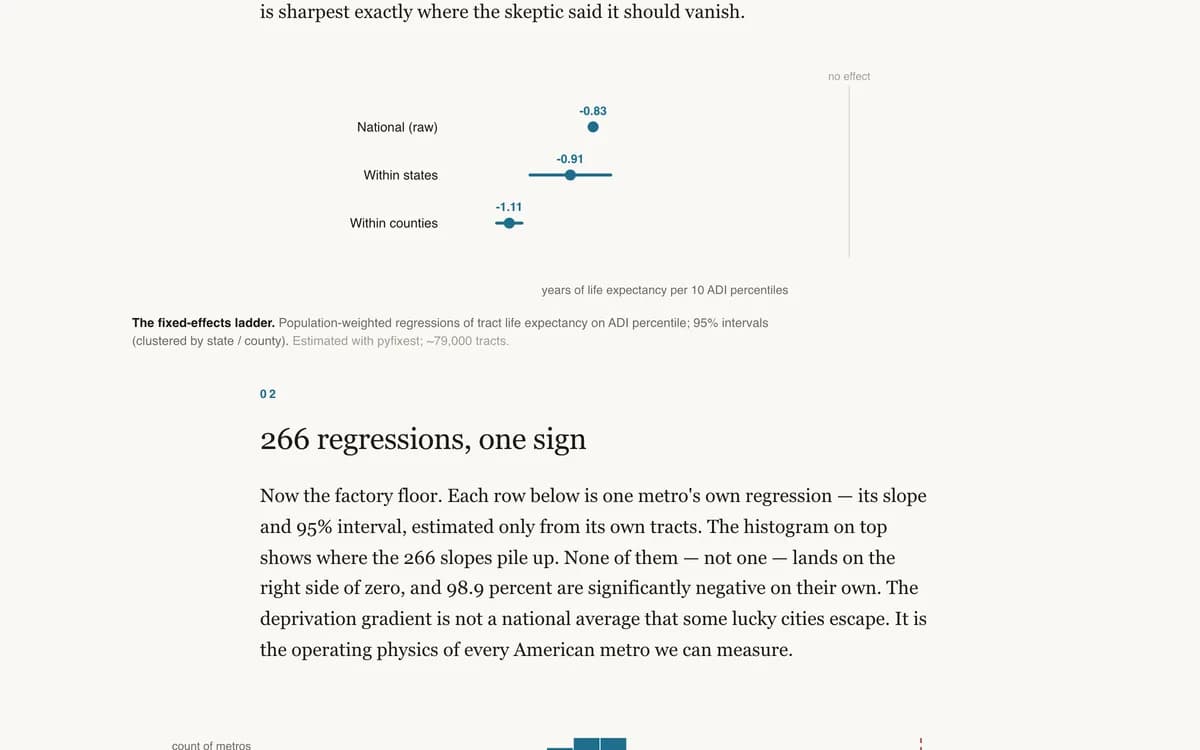
The Slope Factory
We fit the deprivation–life-expectancy regression separately in 266 American metros. Every single slope came back negative. Many small models, one law.
Trump tweet device corpus
Tweet text with timestamps and iPhone/Android attribution labels, likely for authorship, source, or political text analysis.
 App
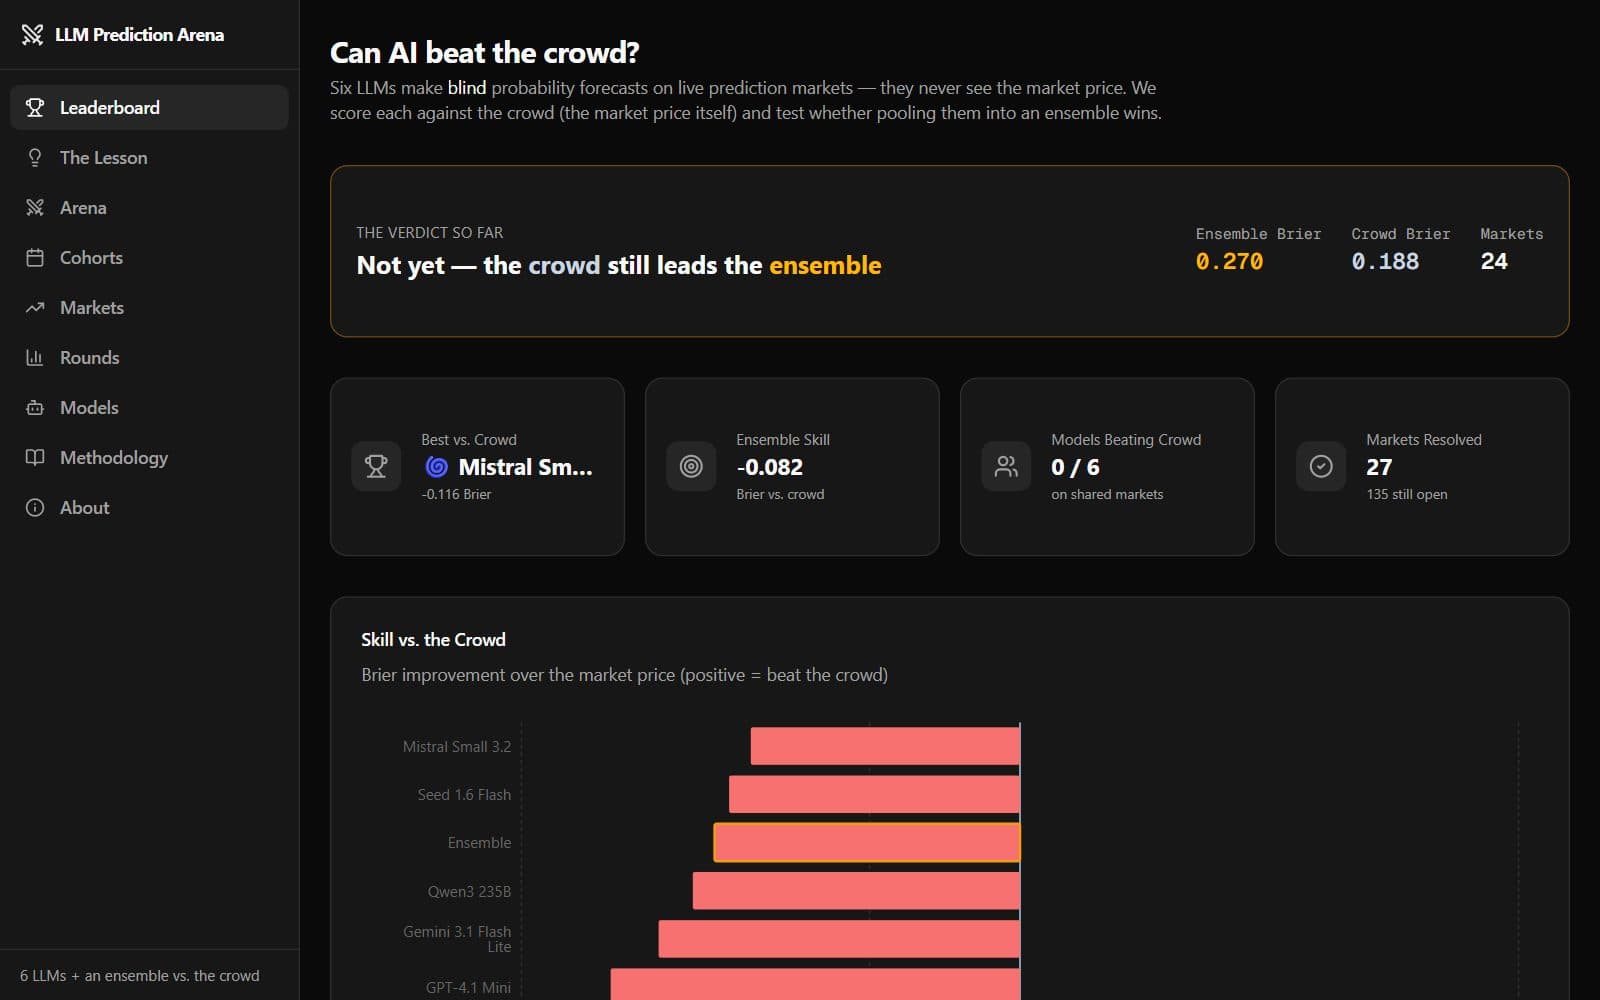
AppLLM Prediction Arena
Can AI beat the crowd? Six LLMs make blind probability forecasts on live prediction markets — scored on calibration and skill against the market price, then pooled into an ensemble.
Beer acquisition tweet sentiment corpus
Tweet corpus around beer-brand acquisition events, with text, source, event timing, acquisition period, URL flag, and date fields.
 Teaching
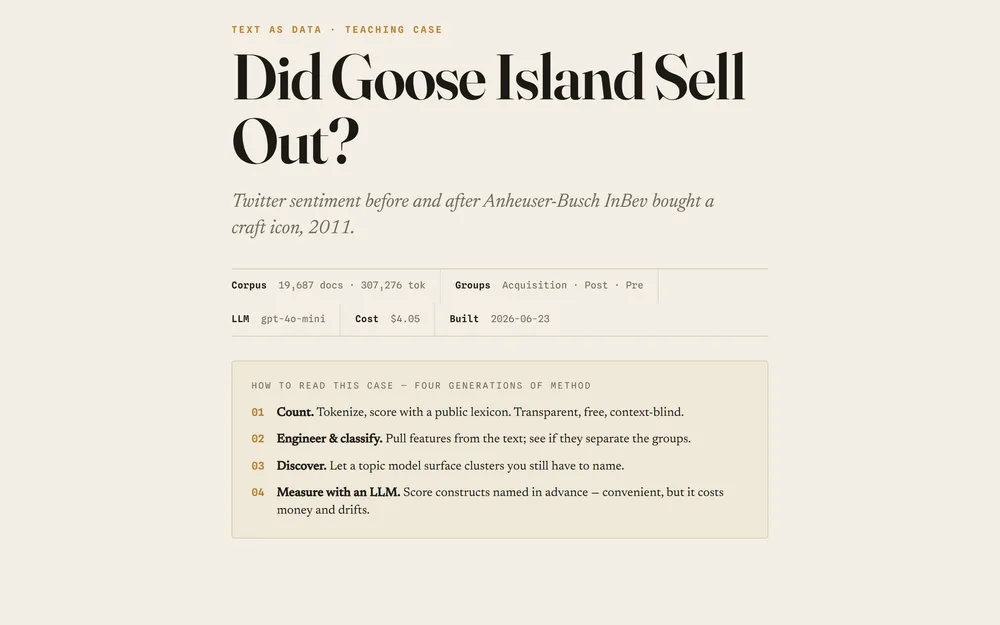
Did Goose Island Sell Out?
On March 28, 2011, Anheuser-Busch InBev acquired Chicago’s Goose Island. This case treats the acquisition as a natural experiment: roughly 20,000 tweets mentioning Goose Island, split into the weeks b
 Teaching
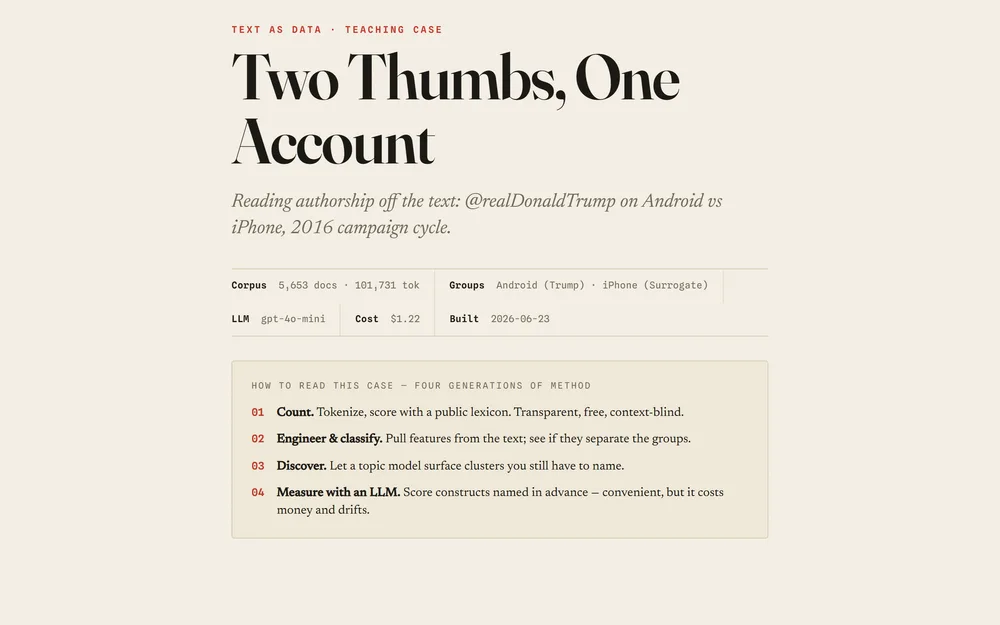
Two Thumbs, One Account
During the 2016 cycle, @realDonaldTrump was posted from two devices. The Washington Post noticed a pattern: warm, on-message tweets came from an iPhone (staff), while the combative ones came from an A
 Teaching
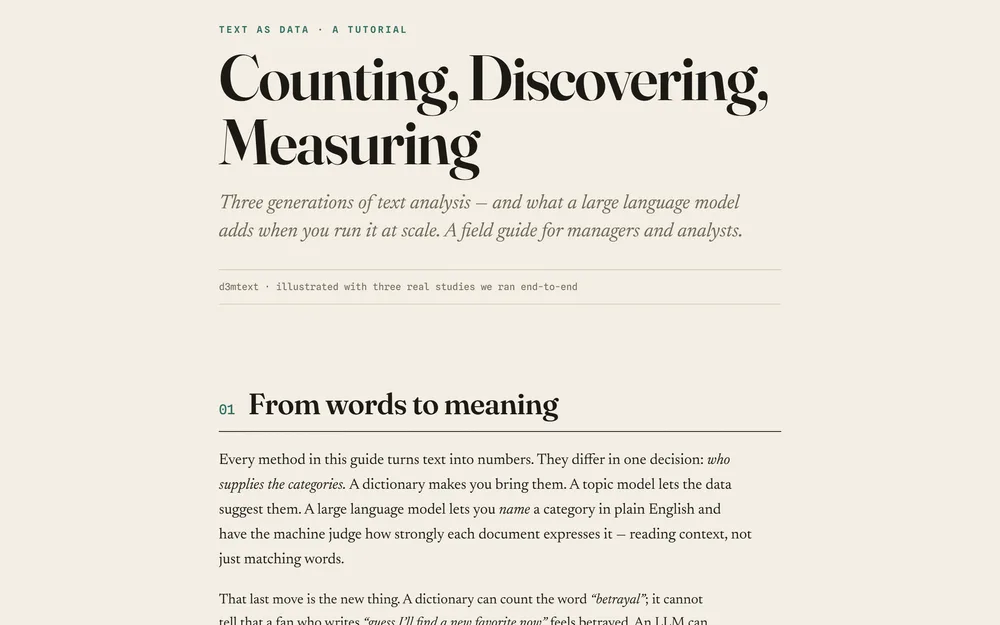
Counting, Discovering, Measuring — text analysis with and without LLMs
Three generations of text-as-data — dictionaries, topic models, and LLM measurement at scale — and what large language models add. A field guide for managers and analysts.